ECG interpretation: Characteristics of the normal ECG (P-wave, QRS complex, ST segment, T-wave)
ECG Interpretation: definitions, criteria, and characteristics of the normal ECG waves, intervals, durations and rhythm
- Overview of the normal electrocardiogram (ECG)
- The P-wave
- PR interval and PR segment
- The QRS complex (ventricular complex)
- Implications and causes of wide (broad) QRS complex
- Amplitude of the QRS complex
- The Q-wave
- The ST segment: ST depression & ST elevation
- Primary and secondary ST-T changes
- ST segment depression
- ST segment elevation
- The T-wave
- U-wave
- QT duration and corrected QT (QTc) duration
- The electrical axis of the heart (heart axis)
This is arguably one of the most important chapters throughout this course. At the heart of ECG interpretation lies the ability to determine whether the ECG waves and intervals are normal. This chapter will focus on the ECG waves in terms of morphology (appearance), durations and intervals. A rather extensive discussion is provided in order to give the reader firm knowledge of normal findings, normal variants (i.e less common variants of what is considered normal) and pathological variants. Thus, in this chapter, you will learn the physiological basis of all ECG waves and how to determine whether the ECG is normal or abnormal. Although heart rhythm will be discussed in detail in the next chapters, fundamental aspects of rhythm will also be covered in this discussion (refer to Normal Rhythm and Arrhythmias). Also note that this chapter is accompanied by a comprehensive video lecture (Video lecture: The Normal ECG).

Overview of the normal electrocardiogram (ECG)
ECG interpretation includes an assessment of the morphology (appearance) of the waves and intervals on the ECG curve. Therefore, ECG interpretation requires a structured assessment of the waves and intervals. Before discussing each component in detail, a brief overview of the waves and intervals is given.
The P-wave, PR interval and PR segment
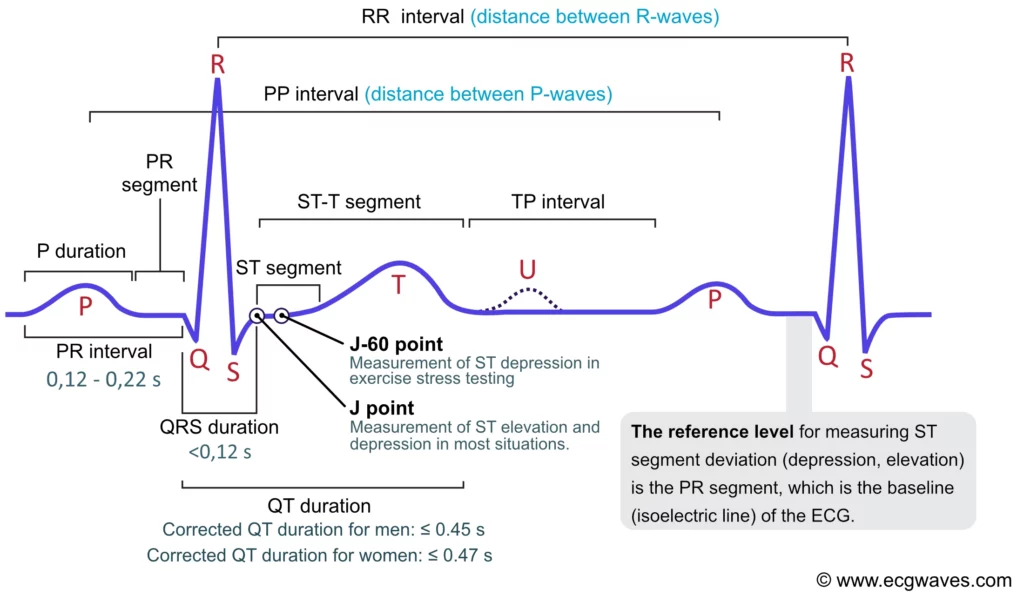
ECG interpretation traditionally starts with an assessment of the P-wave. The P-wave reflects atrial depolarization (activation). The PR interval is the distance between the onset of the P-wave to the onset of the QRS complex. The PR interval is assessed in order to determine whether impulse conduction from the atria to the ventricles is normal. The flat line between the end of the P-wave and the onset of the QRS complex is called the PR segment and it reflects the slow impulse conduction through the atrioventricular node. The PR segment serves as the baseline (also referred to as the reference line or isoelectric line) of the ECG curve. The amplitude of any deflection/wave is measured by using the PR segment as the baseline. Refer to Figure 1.
The QRS complex
The QRS complex represents the depolarization (activation) of the ventricles. It is always referred to as the “QRS complex” although it may not always display all three waves. Since the electrical vector generated by the left ventricle is many times larger than the vector generated by the right ventricle, the QRS complex is actually a reflection of left ventricular depolarization. QRS duration is the time interval from the onset to the end of the QRS complex. A short QRS complex is desirable as it proves that the ventricles are depolarized rapidly, which in turn implies that the conduction system functions properly. Wide (also referred to as broad) QRS complexes indicate that ventricular depolarization is slow, which may be due to dysfunction in the conduction system.
The J point and the ST segment
The ST segment corresponds to the plateau phase (phase 2) of the action potential. The ST segment must always be studied carefully since it is altered in a wide range of conditions. Many of these conditions cause rather characteristic ST segment changes. The ST segment is of particular interest in the setting of acute myocardial ischemia because ischemia causes deviation of the ST segment (ST segment deviation). There are two types of ST segment deviations. ST segment depression implies that the ST segment is displaced, such that it is below the level of the PR segment. ST segment elevation implies that the ST segment is displaced, such that it is above the level of the PR segment. The magnitude of depression/elevation is measured as the height difference (in millimeters) between the J point and the PR segment. The J point is the point where the ST segment starts. If the baseline (PR segment) is difficult to discern, the TP interval may be used as the reference level.
The T-wave
The T-wave reflects the rapid repolarization of contractile cells (phase 3) and T-wave changes occur in a wide range of conditions. T-wave changes are frequently misunderstood in clinical practice, which the discussion below will attempt to cure. The transition from the ST segment to the T-wave should be smooth (and not abrupt). The normal T-wave is slightly asymmetric, with a steeper downward slope.
The U-wave
The U-wave is seen occasionally. It is a positive wave occurring after the T-wave. Its amplitude is generally one-fourth of the T-wave’s amplitude. The U-wave is most frequently seen in leads V2–V4. Individuals with prominent T-waves, as well as those with slow heart rates, display U-waves more often. The genesis of the U-wave remains elusive.
QT interval (duration) and QTc interval
QT duration reflects the total duration of ventricular depolarization and repolarization. It is measured from the onset of the QRS complex to the end of the T-wave. The QT duration is inversely related to heart rate; i.e. the QT interval increases at slower heart rates and decreases at higher heart rates. Therefore to determine whether the QT interval is within normal limits, it is necessary to adjust for the heart rate. The heart rate-adjusted QT interval is referred to as the corrected QT interval (QTc interval). A long QTc interval increases the risk of ventricular arrhythmias.
Now follows the detailed discussion of each ECG of these components.
The P-wave
ECG interpretation usually starts with an assessment of the P-wave. The P-wave is a small, positive and smooth wave. It is small because the atria make a relatively small muscle mass. If the rhythm is sinus rhythm (i.e. under normal circumstances) the P-wave vector is directed downwards and to the left in the frontal plane and this yields a positive P-wave in lead II (Figure 2, right-hand side). The P-wave is always positive in lead II during sinus rhythm. This is rather easy to understand because lead II is angled alongside the P-wave vector, and the exploring electrode is located in front of the P-wave vector (Figure 2, right-hand side).
The P-wave vector is slightly curved in the horizontal plane. It is initially directed forward but then turns left to activate the left atrium (Figure 2, left-hand side). Lead V1 might therefore display a biphasic (diphasic) P-wave, meaning that the greater portion of the P-wave is positive but the terminal portion is slightly negative (the vector generated by left atrial activation heads away from V1). Occasionally, the negative deflection is also seen in lead V2. lead V5 only notes vectors heading toward the exploring electrode (albeit with somewhat varying angles) and therefore displays a positive P-wave throughout.
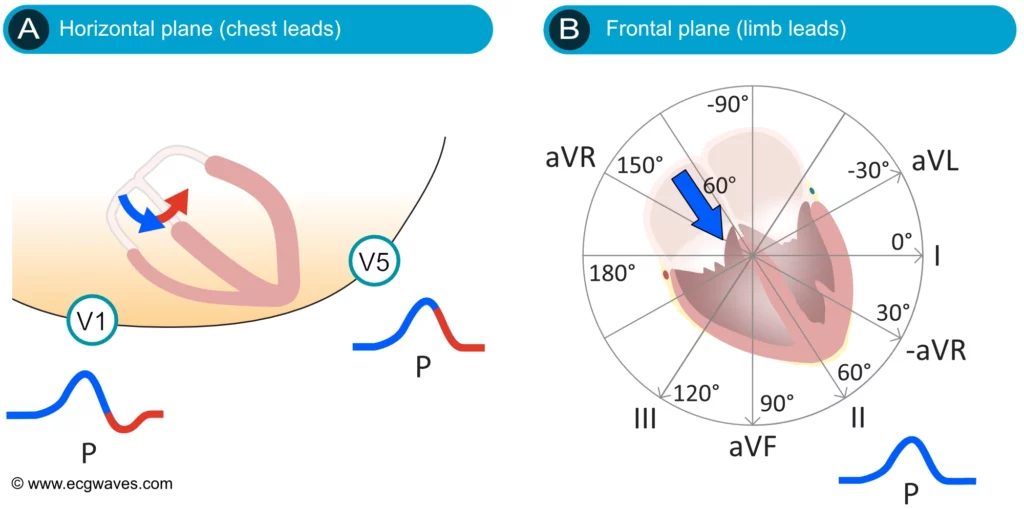
Figure 2 (above) does not show that the P-wave in lead II might actually be slightly asymmetric by having two humps. This is often (but not always) seen on ordinary ECG tracings and it is explained by the fact that the atria are depolarized sequentially, with the right atrium being depolarized before the left atrium. The first half of the P-wave is therefore a reflection of right atrial depolarization and the second half is a reflection of left atrial depolarization. This is shown in Figure 3 (upper panel). Recall that the P-wave in V1 is often biphasic, which is also shown in Figure 3.
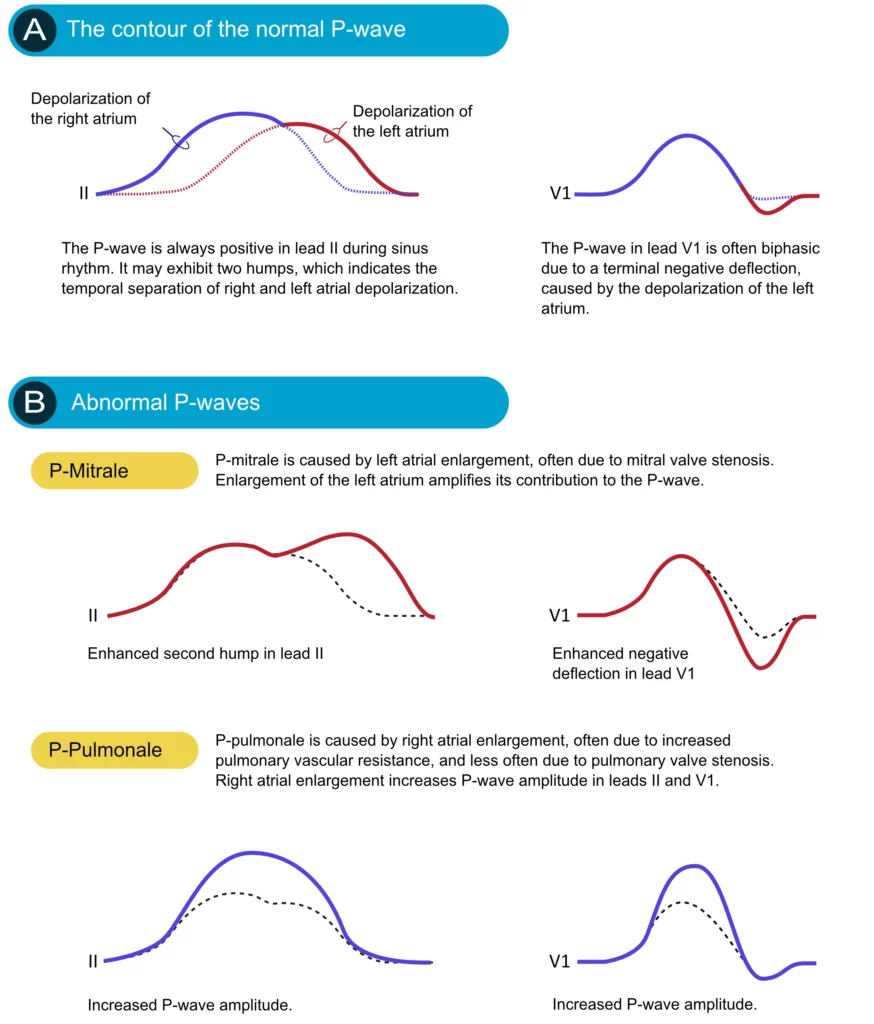
If an atrium becomes enlarged (typically as a compensatory mechanism) its contribution to the P-wave will be enhanced. Enlargement of the left and right atria causes typical P-wave changes in lead II and lead V1 (Figure 3).
Enlargement of the right atrium is commonly a consequence of increased resistance to empty blood into the right ventricle. This may be due to pulmonary valve stenosis, increased pulmonary artery pressure etc. The right atrium must then enlarge (hypertrophy) in order to manage to pump blood into the right ventricle. Right atrial enlargement (hypertrophy) leads to stronger electrical currents and thus enhancement of the contribution of the right atrium to the P-wave. The P-wave will display higher amplitude in lead II and lead V1. Such a P-wave is called P pulmonale because pulmonary diseases are the most common causes (Figure 3, P-pulmonale).
If the left atrium encounters increased resistance (e.g due to mitral valve stenosis) it becomes enlarged (hypertrophy) which amplifies its contribution to the P-wave. The second hump in lead II becomes larger and the negative deflection in V1 becomes deeper. This is called P mitrale, because mitral valve disease is a common cause (Figure 25, P-mitrale).
If the atria are depolarized by impulses generated by cells outside of the sinoatrial node (i.e by an ectopic focus), the morphology of the P-wave may differ from the P-waves in sinus rhythm. If the ectopic focus is located close to the sinoatrial node, the P-wave will have a morphology similar to the P-wave in sinus rhythm. However, an ectopic focus may be located anywhere. If it is located near the atrioventricular node, the activation of the atria will proceed in the opposite direction, which produces an inverted (retrograde) P-wave.
P-wave checklist
- The P-wave is always positive in lead II during sinus rhythm.
- The P-wave is virtually always positive in leads aVL, aVF, –aVR, I, V4, V5 and V6. It is negative in lead aVR.
- The P-wave is frequently biphasic in V1 (occasionally in V2). The negative deflection is normally <1 mm.
- P-wave duration should be ≤0,12 seconds.
- P-wave amplitude should be <2,5 mm in the limb leads.
- P-pulmonale implies that the P-wave has an abnormally high amplitude in lead II (and in other leads in general).
- P-mitrale implies that the second hump of the P-wave in lead II and the negative deflection of the P-wave in lead V1 are both enhanced.
PR interval and PR segment
The PR interval starts at the onset of the P-wave and ends at the onset of the QRS complex (Figure 1). It reflects the time interval from the start of atrial depolarization to the start of ventricular depolarization. The PR interval is assessed in order to determine whether impulse conduction from the atria to the ventricles is normal in terms of speed. The PR interval must not be too long or too short. A normal PR interval ranges between 0.12 seconds to 0.22 seconds.
The flat line between the end of the P-wave and the onset of the QRS complex is called the PR segment and it reflects the slow impulse conduction through the atrioventricular node. The PR segment serves as the baseline (also referred to as the reference line or isoelectric line) of the ECG curve. The amplitude of any deflection/wave is measured by using the PR segment as the baseline.
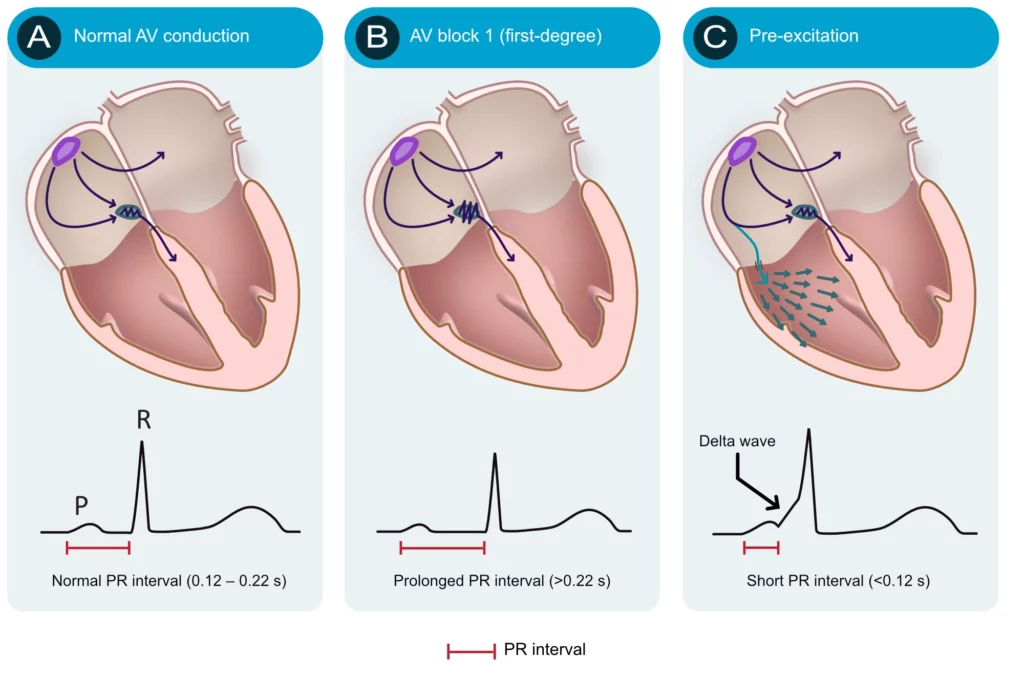
Numerous conditions can diminish the capacity of the atrioventricular node to conduct the atrial impulse to the ventricles. As the conduction diminishes, the PR interval becomes longer. When the PR interval exceeds 0.22 seconds, first-degree AV-block is manifest. The term block is somewhat misleading since it is actually a matter of abnormal delay and not a block per se. The most common cause of first-degree AV-block is degenerative (age-related) fibrosis in the conduction system. Myocardial ischemia/infarction and medications (e.g. beta-blockers) may also cause first-degree AV-block. Note that the upper reference limit (0.22 seconds) should be related to the age of the patient; 0.20 seconds is more suitable for young adults because they have faster impulse conduction. Refer to Figure 4 (second panel). AV blocks are discussed in detail later.
The atrioventricular (AV) node is normally the only connection between the atria and the ventricles. The atria and the ventricles are electrically isolated from each other by the fibrous rings (annulus fibrosus). However, it is not rare to have an additional – accessory – pathway between the atria and the ventricles. Such an accessory pathway is an embryological remnant that may be located almost anywhere between the atria and the ventricles. It enables the atrial impulse to pass directly to the ventricles and start ventricular depolarization prematurely. If the atrial impulse uses an accessory pathway, the impulse delay in the atrioventricular node is bypassed and therefore the PR interval becomes shortened (PR interval <0.12 seconds). The condition is referred to as pre-excitation because the ventricles are excited prematurely. This is illustrated in Figure 4 (third panel). As seen in Figure 4 (third panel) the initial depolarization of the ventricles (starting where the accessory pathway inserts into the ventricular myocardium) is slow because the impulse will not spread via the normal His-Purkinje pathway. The slow initial depolarization is seen as a delta wave on the ECG (Figure 4, third panel). However, apart from the delta wave, the R-wave will appear normal because ventricular depolarization will be executed normally as soon as the atrioventricular node delivers the impulse to the His-Purkinje system.
PR interval checklist
- Normal PR interval: 0,12–0,22 seconds. The upper reference limit is 0,20 seconds in young adults.
- A prolonged PR interval (>0.22 s) is consistent with first-degree AV block.
- A shortened PR interval (<0,12 s) indicates pre-excitation (presence of an accessory pathway). This is associated with a delta wave.
The QRS complex (ventricular complex)
A complete QRS complex consists of a Q-, R- and S-wave. However, all three waves may not be visible and there is always variation between the leads. Some leads may display all waves, whereas others might only display one of the waves. Regardless of which waves are visible, the wave(s) that reflect ventricular depolarization is always referred to as the QRS complex.
Naming of the waves in the QRS complex:
The naming of the waves in the QRS complex is easy but frequently misunderstood. The following rules apply when naming the waves:
- A deflection is only referred to as a wave if it passes the baseline.
- If the first wave is negative then it is referred to as Q-wave. If the first wave is not negative, then the QRS complex does not possess a Q-wave, regardless of the appearance of the QRS complex.
- All positive waves are referred to as R-waves. The first positive wave is simply an “R-wave” (R). The second positive wave is called “R-prime wave” (R’). If a third positive wave occurs (rare) it is referred to as “R-bis wave” (R”).
- Any negative wave occurring after a positive wave is an S-wave.
- Large waves are referred to by their capital letters (Q, R, S), and small waves are referred to by their lower-case letters (q, r, s).
Figure 5 shows examples of the naming of the QRS complex.
Log in to view image, video, quiz, text

Net direction of the QRS complex
The QRS complex can be classified as net positive or net negative, referring to its net direction. The QRS complex is net positive if the sum of the positive areas (above baseline) exceeds that of the negative areas (below baseline). Refer to Figure 6, panel A. These calculations are approximated simply by eyeballing. Panel B in Figure 6 shows a net negative QRS complex because the negative areas are greater than the positive area.
Log in to view image, video, quiz, text
Electrical vectors that engender the QRS complex
Depolarization of the ventricles generates three large vectors, which explains why the QRS complex is composed of three waves. It is fundamental to understand the genesis of these waves and although it has been discussed previously a brief rehearsal is warranted. Figure 7 illustrates the vectors in the horizontal plane. Study Figure 7 carefully, as it illustrates how the P-wave and QRS complex are generated by the electrical vectors.
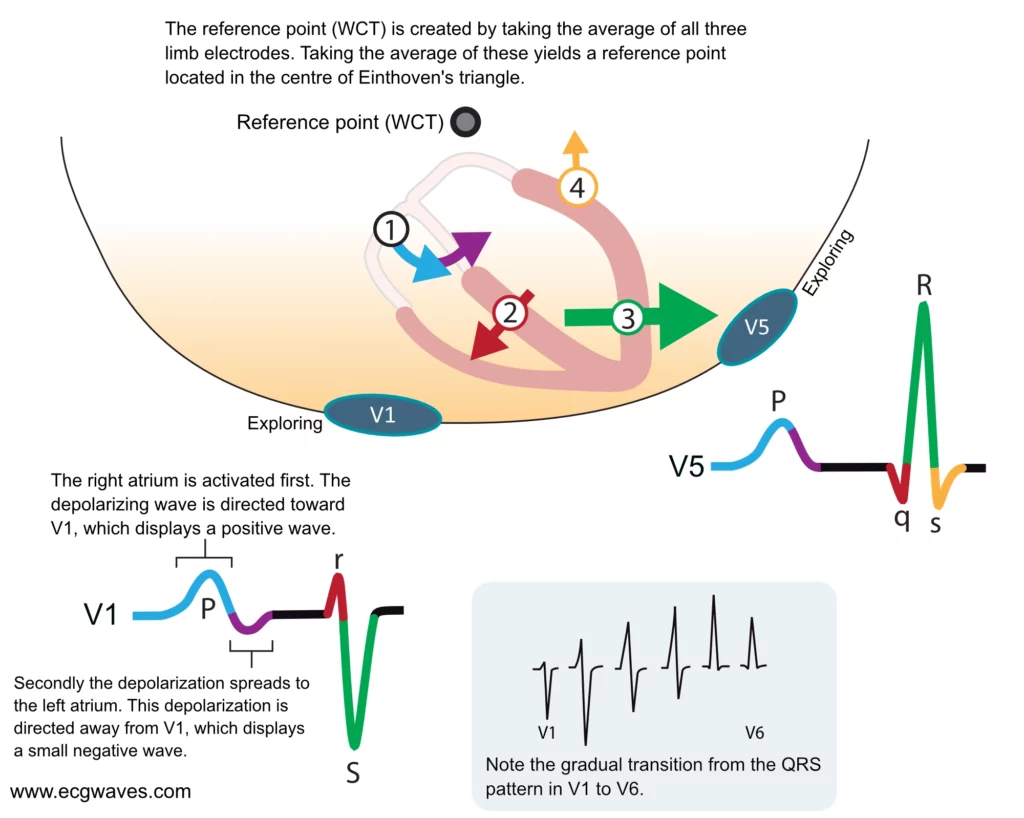
Note that the first vector in Figure 7 is not discussed here as it belongs to atrial activity.
The second vector: the ventricular (interventricular) septum
The ventricular septum receives Purkinje fibers from the left bundle branch and therefore depolarization proceeds from its left side towards its right side. The vector is directed forward and to the right. The ventricular septum is relatively small, which is why V1 displays a small positive wave (r-wave) and V5 displays a small negative wave (q-wave). Thus, it is the same electrical vector that results in an r-wave in V1 and q-wave in V5.
The third vector: the ventricular free wall
The vectors resulting from the activation of the ventricular free walls are directed to the left and downwards (Figure 7). The explanation for this is as follows:
- The vector resulting from activation of the right ventricle does not come to expression, because it is drowned by the many times larger vector generated by the left ventricle. Thus, the vector during activation of the ventricular free walls is actually the vector generated by the left ventricle.
- Activation of the ventricular free wall proceeds from the endocardium to the epicardium. This is because the Purkinje fibers run through the endocardium, where they deliver the action potential to contractile cells. The subsequent spread of the action potential occurs from one contractile cell to another, starting in the endocardium and heading toward the epicardium.
As evident from Figure 7, the vector of the ventricular free wall is directed to the left (and downwards). Lead V5 detects a very large vector heading towards it and therefore displays a large R-wave. Lead V1 records the opposite and therefore displays a large negative wave called S-wave.
The fourth vector: basal parts of the ventricles
The final vector stems from the activation of the basal parts of the ventricles. The vector is directed backward and upwards. It heads away from V5 which records a negative wave (s-wave). Lead V1 does not detect this vector.
Implications and causes of wide (broad) QRS complex
Prolongation of QRS duration implies that ventricular depolarization is slower than normal. The QRS duration is generally <0,10 seconds but must be <0,12 seconds. If the QRS duration is ≥ 0,12 seconds (120 milliseconds) then the QRS complex is abnormally wide (broad). This is a very common and significant finding. The reason for wide QRS complexes must always be clarified. Clinicians often perceive this as a difficult task despite the fact that the list of differential diagnoses is rather short. The following causes of wide QRS complexes must be familiar to all clinicians:
- Bundle branch block: The left and the right bundle branch consists of Purkinje fibers which spread out into the ventricular myocardium. The Purkinje network enables fast impulse conduction so that the action potential can be delivered to the whole myocardium at the same time (approximately). A bundle branch block occurs if a bundle branch is dysfunctional and unable to transmit the impulse. The ventricle whose bundle is blocked will have to wait for electrical impulses to spread from the other ventricle. Because the spread of the impulse from the other ventricle will take place partly or entirely outside of the conduction system, it will be slow and therefore the QRS duration is prolonged.
- Hyperkalemia: Hyperkalemia causes slow impulse transmission (in all myocardial and conduction cells) and prolongation of the QRS duration.
- Drugs: class I antiarrhythmic drugs, tricyclic antidepressants, and other medications can cause a widening of the QRS complex.
- Ventricular rhythm, ventricular ectopy, and pacemaker with ventricular stimulation:
- Spontaneous action potentials discharged within the ventricles may depolarize the ventricles. The cell/structure which discharges the action potential is referred to as an ectopic focus. Such a focus may fire single or multiple impulses (either consecutively or intermittently). A single impulse gives rise to a premature ventricular beat, whereas multiple impulses may establish a ventricular rhythm, or even ventricular tachycardia. In all these instances the QRS complex will be broad because the depolarizing impulse arises and spreads outside of the normal conduction system.
- External (artificial) pacemakers have an electrode inserted in the right ventricular apex. Electrical stimulation in the right ventricular apex will give rise to an action potential propagating from there, i.e. partly or entirely outside of the conduction system (which will cause wide QRS complexes).
- Pre-excitation (Wolff-Parkinson-White syndrome): Pre-excitation implies the existence of an accessory pathway (in addition to the atrioventricular node) between the atria and the ventricles. Such pathways virtually always insert into the ventricular myocardium, from where the action potential spreads. Again, the spread takes place outside of the conduction system which is slow and causes widening of the QRS complex.
- Aberrant ventricular conduction (aberrancy): Aberrant conduction is actually a bundle branch block that occurs when the length of the cardiac cycle is rapidly changed, particularly at high heart rates. The bundle branches (particularly the right bundle branch) may occasionally fail to adapt their repolarization period to the length of the cardiac cycle (which they also do). This is discussed in detail in the article on aberrant ventricular conduction.
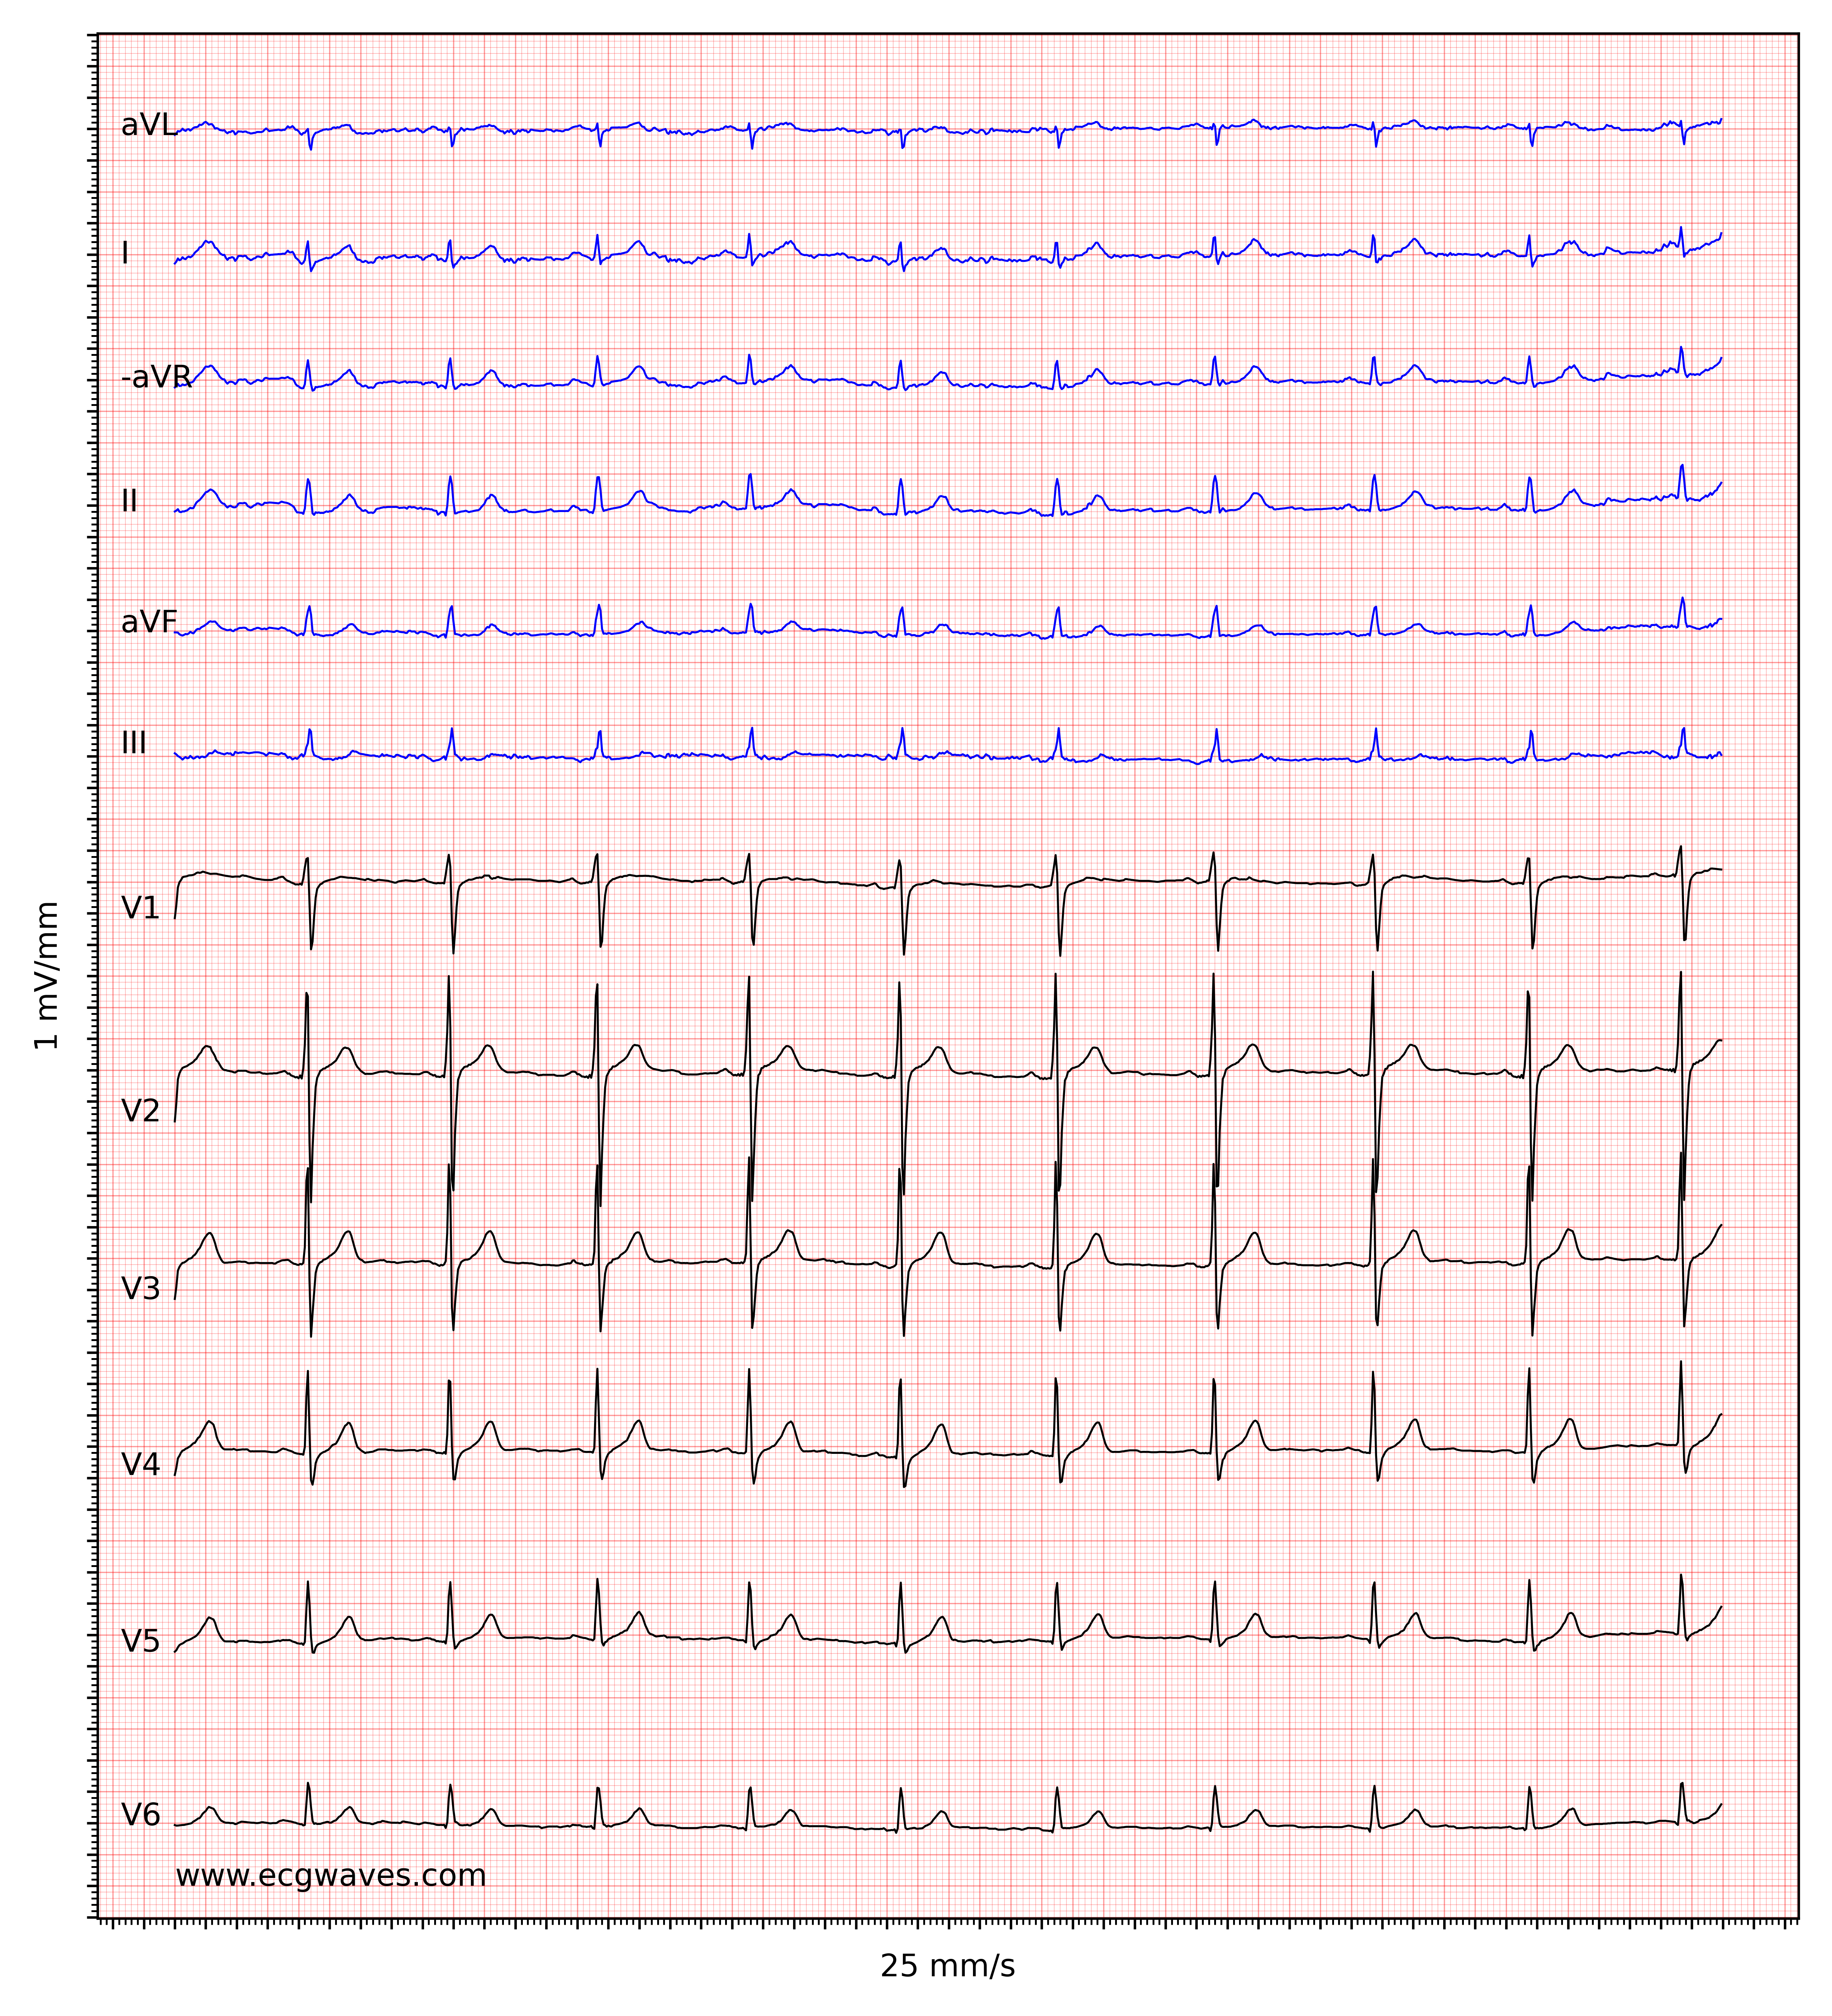
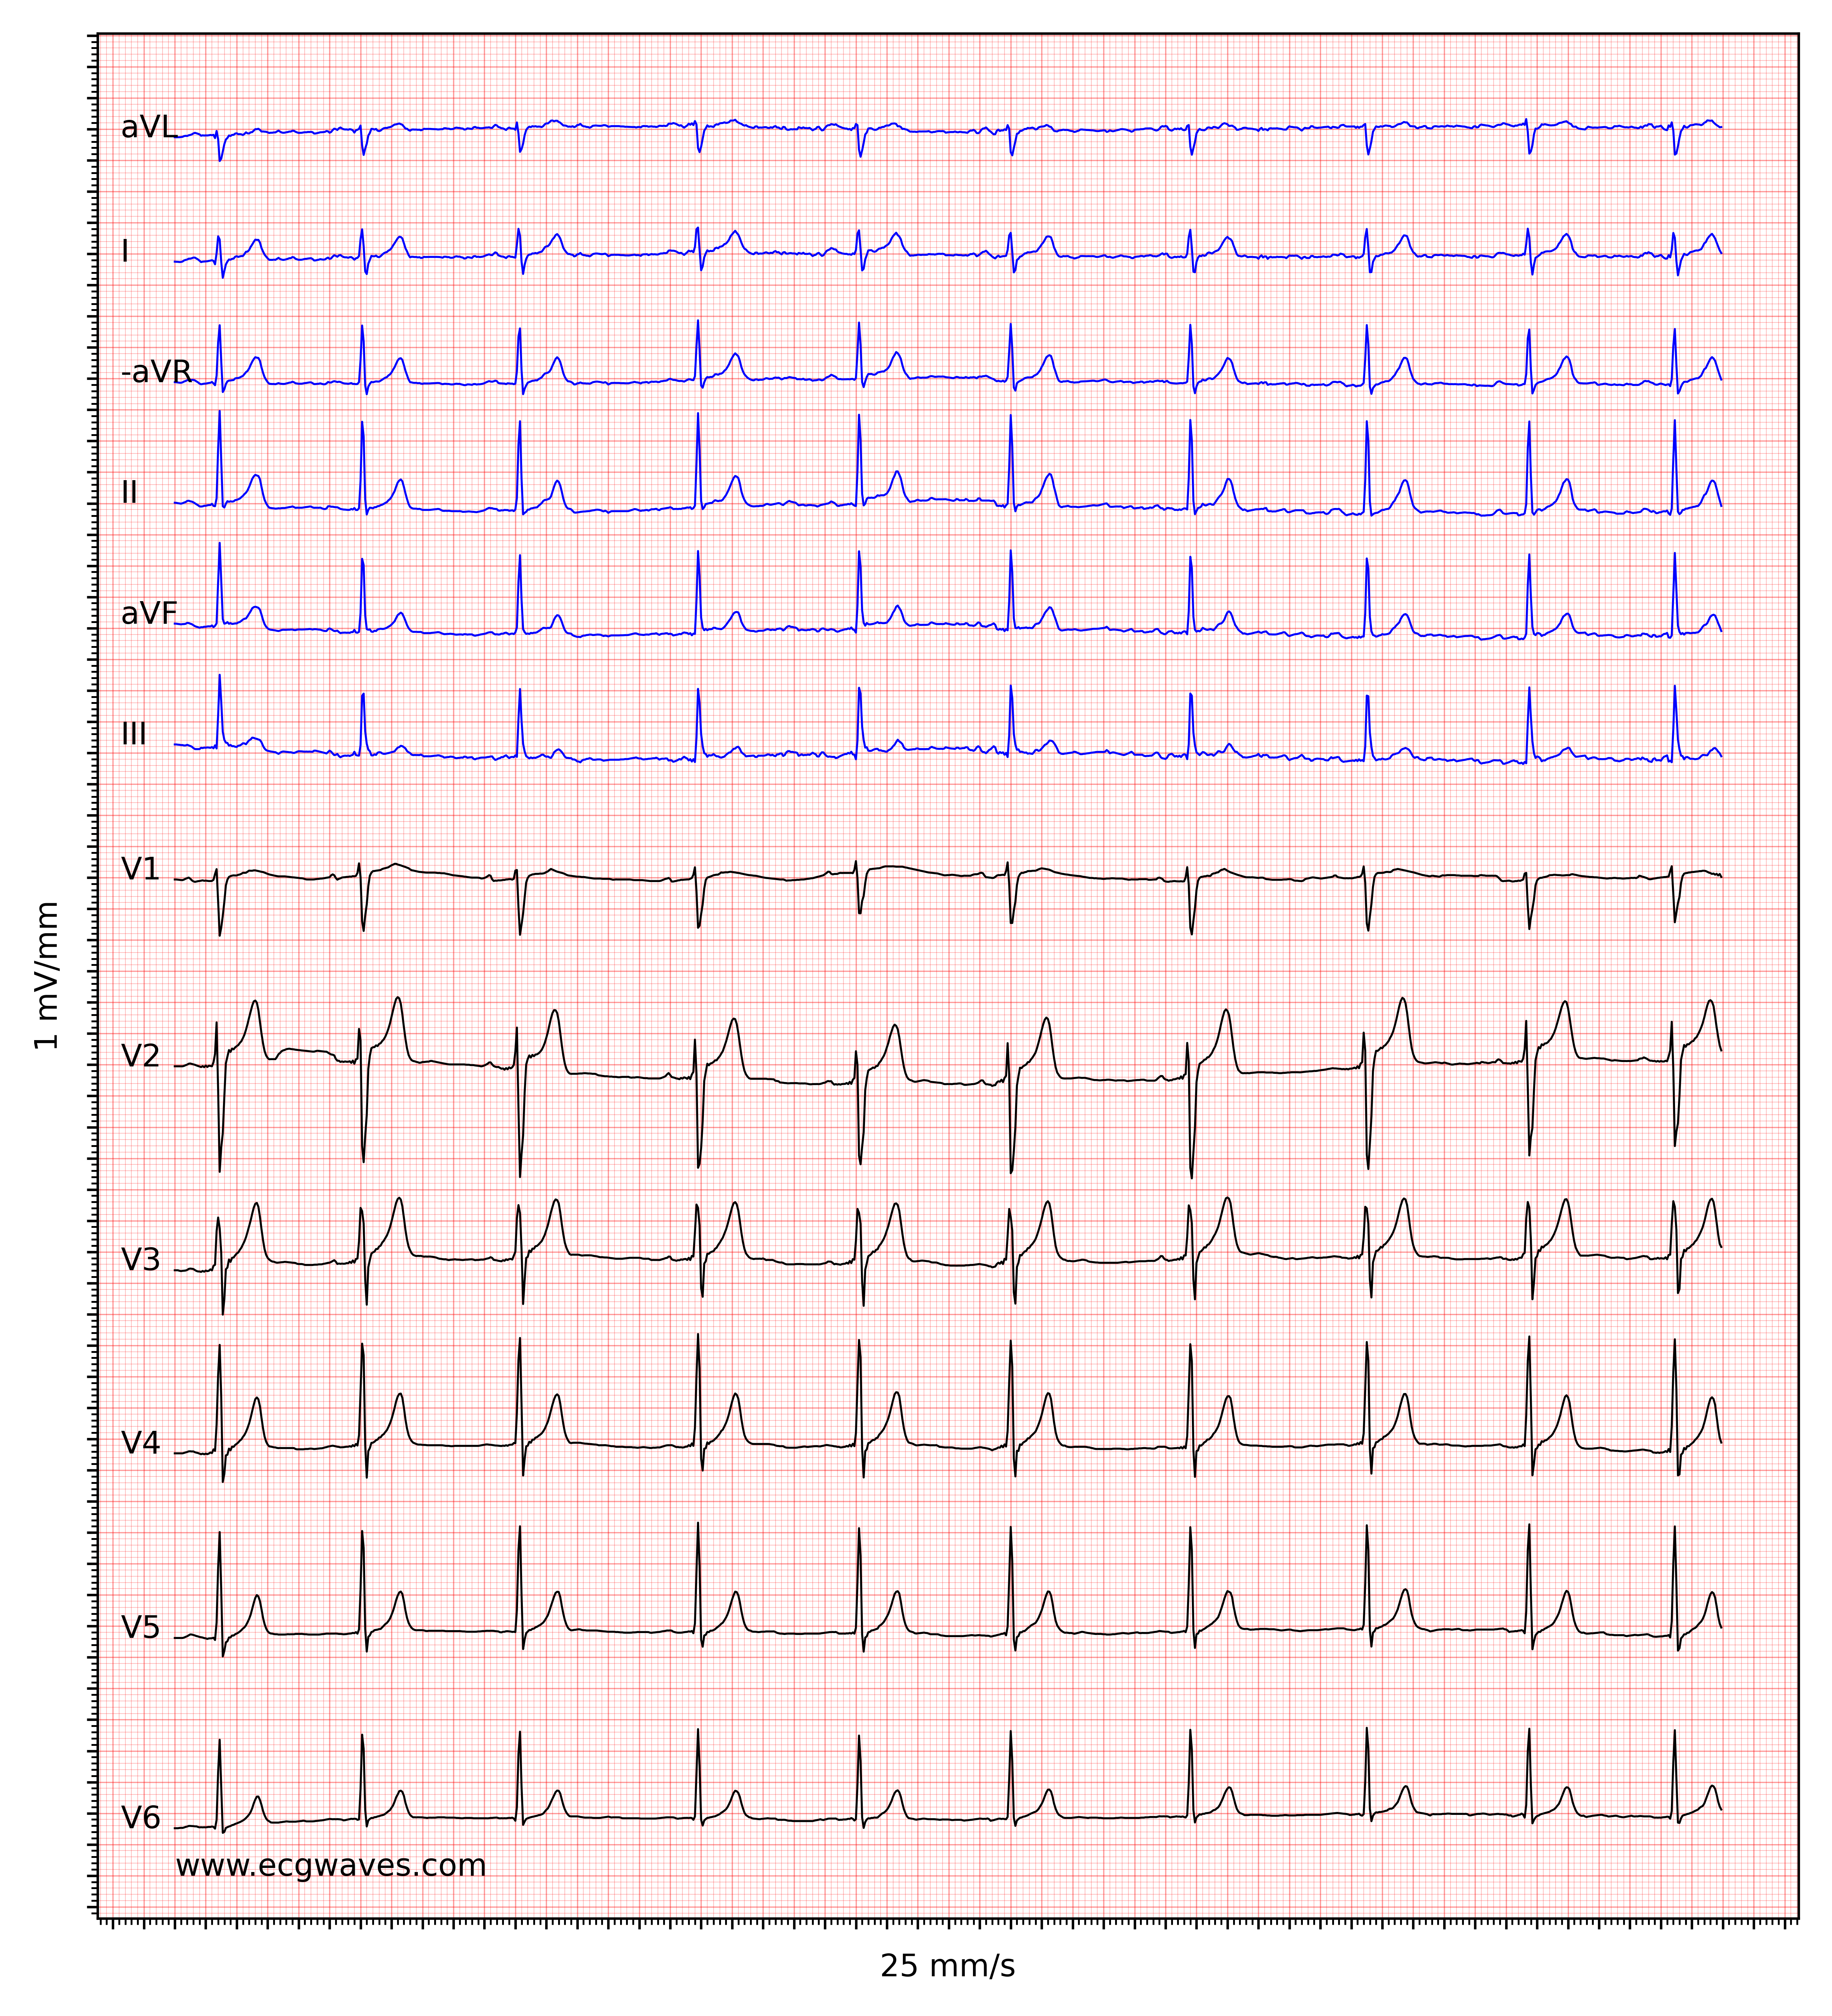
Figure 8 (below) shows normal and abnormally wide QRS complexes at 25 mm/s and 50 mm/s paper speed.

Amplitude of the QRS complex
A QRS complex with large amplitudes may be explained by ventricular hypertrophy or enlargement (or a combination of both). The electrical currents generated by the ventricular myocardium are proportional to the ventricular muscle mass. Hypertrophy means that there are more muscles and hence larger electrical potentials generated. However, the distance between the heart and the electrodes may have a significant impact on the amplitudes of the QRS complex. For example, slender individuals generally have a shorter distance between the heart and the electrodes, as compared with obese individuals. Therefore, the slender individual may present with much larger QRS amplitudes. Similarly, a person with chronic obstructive pulmonary disease (COPD) often displays diminished QRS amplitudes due to hyperinflation of the thorax (increased distance to electrodes). Low amplitudes may also be caused by hypothyreosis. In the setting of circulatory collapse, low amplitudes should raise suspicion of cardiac tamponade.
R-wave amplitude
It is important to assess the amplitude of the R-waves. High amplitudes may be due to ventricular enlargement or hypertrophy. To determine whether the amplitudes are enlarged, the following references are at hand:
- R-wave should be < 26 mm in V5 and V6.
- R-wave amplitude in V5 + S-wave amplitude in V1 should be <35 mm.
- R-wave amplitude in V6 + S-wave amplitude in V1 should be <35 mm.
- R-wave amplitude in aVL should be ≤ 12 mm.
- R-wave amplitude in leads I, II and III should all be ≤ 20 mm.
- If R-wave in V1 is larger than S-wave in V1, the R-wave should be <5 mm.
(1 mm corresponds to 0.1 mV on standard ECG grid).
R-wave peak time
R-wave peak time (Figure 9) is the interval from the beginning of the QRS-complex to the apex of the R-wave. This interval reflects the time elapsed for the depolarization to spread from the endocardium to the epicardium. R-wave peak time is prolonged in hypertrophy and conduction disturbances.
Normal values for R-wave peak time follow:
- Leads V1-V2 (right ventricle) <0,035 seconds
- Leads V5-V6 (left ventricle) <0,045 seconds
Log in to view image, video, quiz, text
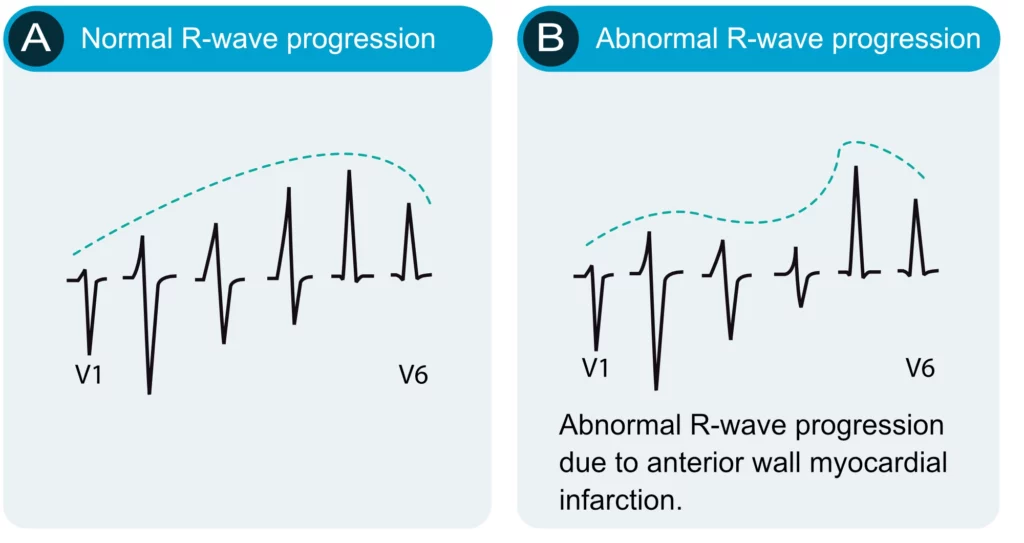
R-wave progression
R-wave progression is assessed in the chest (precordial) leads. Normal R-wave progression implies that the R-wave gradually increases in amplitude from V1 to V5 and then diminishes in amplitude from V5 to V6 (Figure 10, left-hand side). The S-wave undergoes the opposite development. Abnormal R-wave progression is a common finding which may be explained by any of the following conditions:
- Myocardial infarction: necrotic myocardium does not generate electrical potentials and therefore there is a loss of R-wave amplitude in the ECG leads reflecting the necrotic area (Figure 10, right-hand side).
- Cardiomyopathy may cause either loss or gain of R-wave amplitude, depending on the type of cardiomyopathy. Amplitudes may be increased in hypertrophic cardiomyopathy, whereas they are typically diminished in late stages of dilated cardiomyopathy.
- Right and left ventricular hypertrophy also amplifies the R-wave amplitude. Left ventricular hypertrophy causes increased R-wave amplitudes in V4–V6 and deeper S-waves in V1–V3. Right ventricular hypertrophy causes large R-waves in V1–V3 and smaller R-waves in V4–V6.
- Pre-excitation, bundle branch block and chronic obstructive pulmonary disease (COPD) may also affect R-wave progression. These conditions are discussed in detail later on.
Note that the R-wave is occasionally missing in V1 (may be due to misplacement of the electrode). This is considered a normal finding provided that an R-wave is seen in V2.
Dominant R-wave in V1/V2
As seen in Figure 10 (left-hand side) the R-wave in V1–V2 is considerably smaller than the S-wave in V1–V2. Dominant R-wave in V1/V2 implies that the R-wave is larger than the S-wave, and this may be pathological. If the R-wave is larger than the S-wave, the R-wave should be <5 mm, otherwise the R-wave is abnormally large. This may be explained by right bundle branch block, right ventricular hypertrophy, hypertrophic cardiomyopathy, posterolateral ischemia/infarction (if the patient experiences chest pain), pre-excitation, dextrocardia or misplacement of chest electrodes.
The Q-wave
It is crucial to differentiate normal from pathological Q-waves, particularly because pathological Q-waves are rather firm evidence of previous myocardial infarction. However, there are numerous other causes of Q-waves, both normal and pathological and it is important to differentiate these.
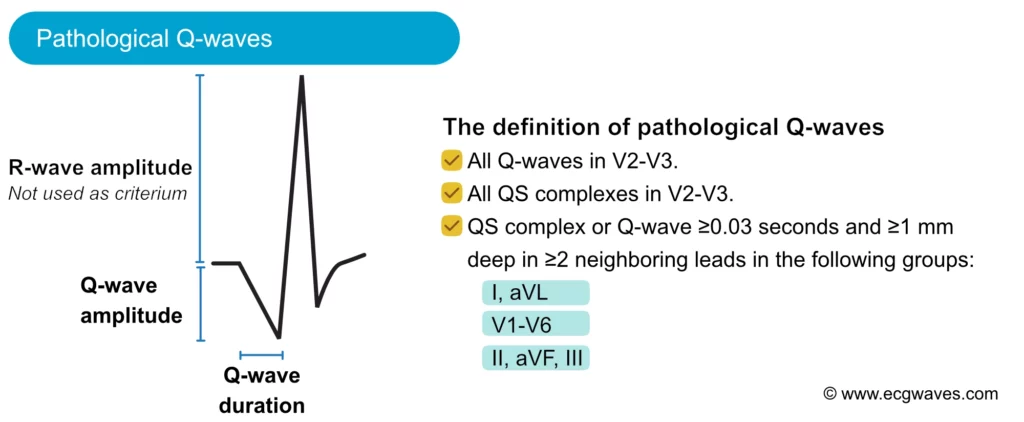
The amplitude (depth) and the duration (width) of the Q-wave dictate whether it is abnormal or not. Pathological Q-waves have a duration ≥0,03 sec and/or amplitude ≥25% of the R-wave amplitude. Pathological Q-waves must exist in at least two anatomically contiguous leads (i.e neighboring leads, such as aVF and III, or V4 and V5) in order to reflect an actual morphological abnormality. The existence of pathological Q-waves in two contiguous leads is sufficient for a diagnosis of Q-wave infarction. This is illustrated in Figure 11.
Normal variants of Q-waves
Septal q-waves are small q-waves frequently seen in the lateral leads (V5, V6, aVL, I). They are due to the normal depolarization of the ventricular septum (see the previous discussion). Two small septal q-waves can actually be seen in V5–V6 in Figure 10 (left-hand side).
An isolated and often large Q-wave is occasionally seen in lead III. The amplitude of this Q-wave typically varies with ventilation and it is therefore referred to as a respiratory Q-wave. Note that the Q-wave must be isolated to lead III (i.e the neighboring lead, which is aVF, must not display a pathological Q-wave).
As noted above, the small r-wave in V1 is occasionally missing, which leaves a QS-complex in V1 (a QRS complex consisting of only a Q-wave is referred to as a QS-complex). This is considered a normal finding provided that lead V2 shows an r-wave. If the R-wave is missing in lead V2 as well, then the criteria for pathology is fulfilled (two QS-complexes).
Small Q-waves (which do not fulfill criteria for pathology) may be seen in all limb leads as well as V4–V6. If these Q-waves do not fulfill the criteria for pathology, then they should be accepted. Leads V1–V3, on the other hand, should never display Q-waves (regardless of their size).
Abnormal (pathological) Q-waves
The most common cause of pathological Q-waves is myocardial infarction. If myocardial infarction leaves pathological Q-waves, it is referred to as Q-wave infarction. Criteria for such Q-waves are presented in Figure 11. Note that pathological Q-waves must exist in two anatomically contiguous leads.
Other causes of abnormal Q-waves are as follows:
- Left-sided pneumothorax
- Dextrocardia
- Perimyocarditis
- Cardiomyopathy
- Amyloidosis
- Bundle branch blocks, fascicular blocks
- Pre-excitation (WPW syndrome)
- Ventricular hypertrophy
- Acute cor pulmonale
To differentiate these causes of abnormal Q-waves from Q-wave infarction, the following can be advised:
- If it is unlikely that the patient has coronary heart disease, other causes are more likely. It should be noted, however, that up to 20% of Q-wave infarctions may develop without symptoms (The Framingham Heart Study).
- If coronary heart disease is likely, then infarction is the most probable cause of the Q-waves.
- The longer the Q-wave duration, the more likely it is that infarction is the cause of the Q-waves. Infarction Q-waves are typically >40 ms.
Examples of normal and pathological Q-waves (after acute myocardial infarction) are presented in Figure 12 below.
Log in to view image, video, quiz, text
The ST segment: ST depression & ST elevation
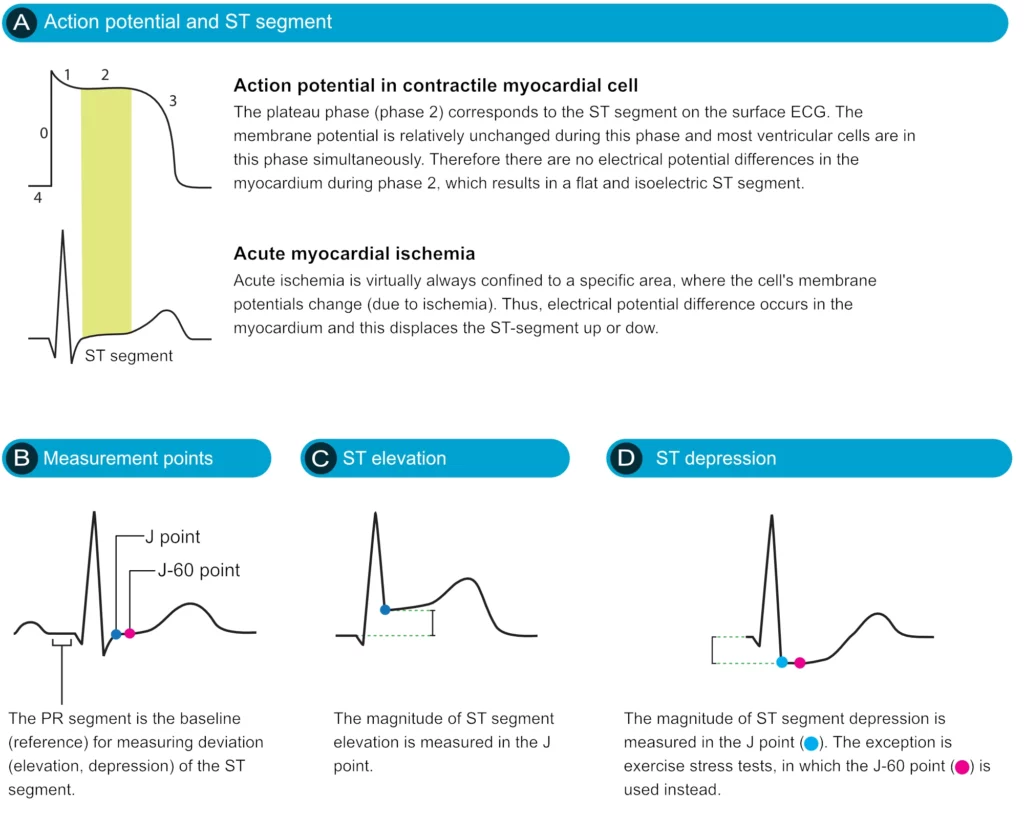
The ST segment corresponds to the plateau phase of the action potential (Figure 13). The ST segment extends from the J point to the onset of the T-wave. Because of the long duration of the plateau phase, most contractile cells are in this phase at the same time (more or less). Moreover, the membrane potential is relatively unchanged during the plateau phase. These two factors are the reason why the ST segment is flat and isoelectric (i.e. in level with the baseline).
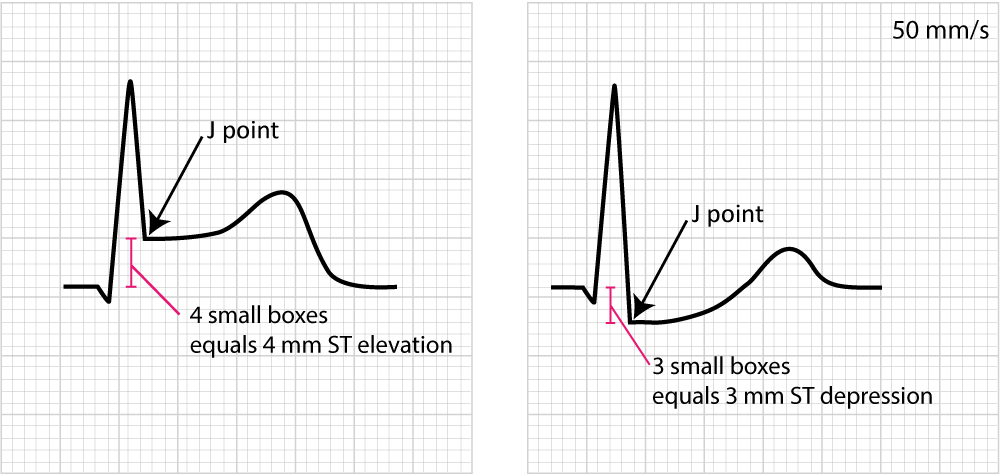
Displacement of the ST segment is of fundamental importance, particularly in acute myocardial ischemia. Because myocardial ischemia affects a limited area and disturbs the cells’ membrane potential (during phase 2), it engenders an electrical potential difference in the myocardium. The electrical potential difference exists between ischemic and normal myocardium and it results in the displacement of the ST segment. The ST segment may be displaced upwards (ST segment elevation) or downwards (ST segment depression). The term ST segment deviation refers to the elevation and depression of the ST segment. The magnitude of ST segment deviation is measured as the height difference (in millimeters) between the J point and the PR segment. Refer to Figure 13 for examples.
Figure 14 below shows how to measure ST segment deviation.
The following must be noted regarding the ST segment:
- The normal ST segment is flat and isoelectric. The transition from ST segment to T-wave is smooth, and not abrupt.
- ST segment deviation (elevation, depression) is measured as the height difference (in millimeters) between the J point and the baseline (the PR segment). ST segment deviation occurs in a wide range of conditions, particularly acute myocardial ischemia.
- Because the ST segment and the T-wave are electrophysiologically related, changes in the ST segment are frequently accompanied by T-wave changes. The term ST-T segment changes (or simply ST-T changes) is used to refer to such ECG changes.
It must also be noted that the J point is occasionally suboptimal for measuring ST segment deviation. This is explained by the fact that the J point is not always isoelectric; this occurs if there are electrical potential differences in the myocardium by the end of the QRS complex (it typically causes J point depression). The reason for such electrical potential difference is that not all ventricular myocardial cells will finish their action potential simultaneously. Myocardial cells which depolarized at the beginning of the QRS complex will not be in the exact same phase as cells that depolarized during the end of the QRS complex. Due to this, it is sometimes recommended that ST segment deviation be measured in the J-60 point, or J-80 point, which is located 60 and 80 milliseconds, respectively, after the J point (Comprehensive Electrocardiology, MacFarlane et al, Springer, 2010; Chou’s Electrocardiologi, Surawicz, Elsevier 2010). At the time of J-60 and J-80, there is minimal chance that there are any electrical potential differences in the myocardium. Current guidelines, however, still recommend the use of the J point for assessing acute ischemia (Third Universal Definition of Myocardial Infarction, Thygesen et al, Circulation). A notable exception to this rule is the exercise stress test, in which the J-60 or J-80 is always used (because exercise frequently causes J point depression).
As mentioned above there are numerous other conditions that affect the ST-T segment and it is fundamental to be able to differentiate these. For this purpose, it is wise to subdivide ST-T changes into primary and secondary.
Primary and secondary ST-T changes
Primary ST-T changes are caused by abnormal repolarization. This is seen in ischemia, electrolyte disorders (calcium, potassium), tachycardia, increased sympathetic tone, drug side effects etc.
Secondary ST-T changes occur when abnormal depolarization causes abnormal repolarization. This is seen in bundle branch blocks (left and right bundle branch block), pre-excitation, ventricular hypertrophy, premature ventricular complexes, pacemaker stimulated beats etc. In each of these conditions, the depolarization is abnormal and this affects the repolarization so that it cannot be carried out normally.
The next discussion will be devoted to characterizing important and common ST-T changes.
ST segment depression
ST segment depression is measured in the J point. The reference point is, as usual, the PR segment. ST segment depression less than 0.5 mm is accepted in all leads. ST segment depression 0.5 mm or more is considered pathological. Some expert consensus documents also note that any ST segment depression in V2–V3 should be considered abnormal (because healthy individuals rarely display depressions in those leads). Please note that every cause of ST segment depression discussed below is illustrated in Figure 15. Study this figure carefully.
Primary ST depressions
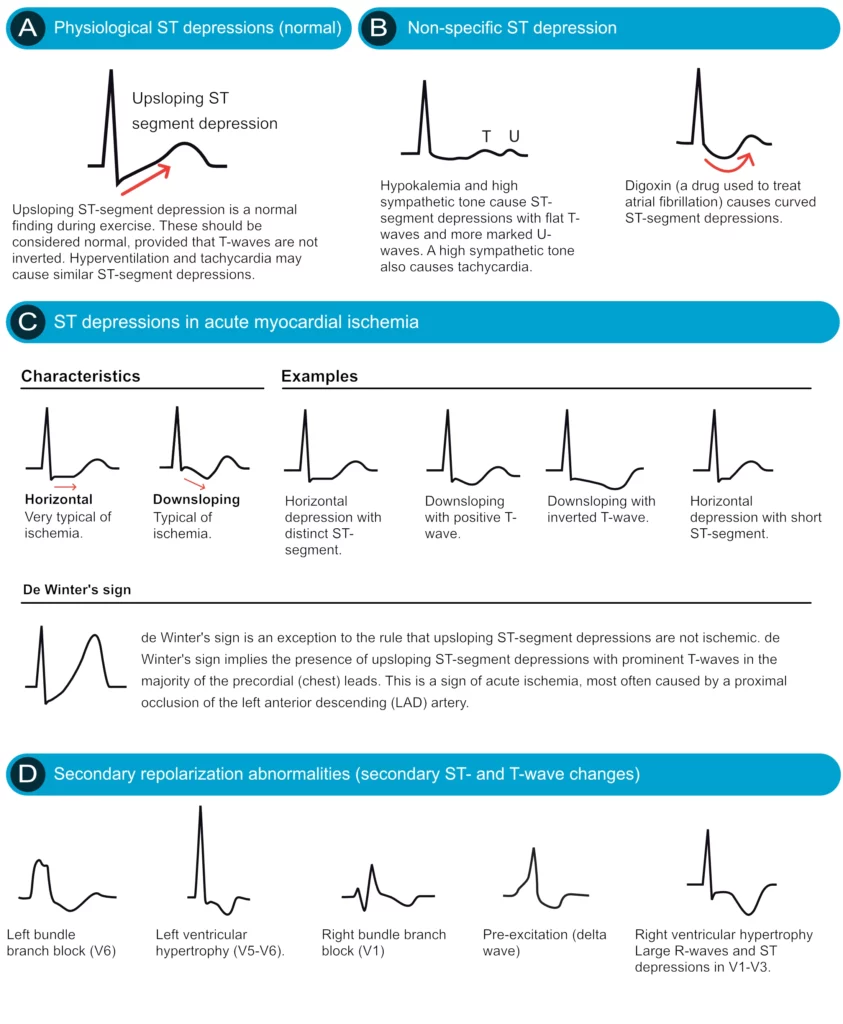
Physiological ST segment depressions occur during physical exercise. These ST segment depressions display an upsloping ST segment, typically depressed <1 mm in the J-60 point and the depressions are normalized rapidly after the exercise has ended. Hyperventilation brings about the same ST segment depressions as physical exercise. Figure 15 A.
Digoxin causes generalized ST segment depressions with a curved ST segment (generalized implies that the depression can be seen in most ECG leads). Figure 15 B.
Sympathetic tone and hypokalemia cause ST segment depressions (typically <0.5 mm).
Heart failure may cause ST segment depression in the left lateral leads (V5, V6, aVL and I) and these depressions are generally horizontal or downsloping.
Supraventricular tachycardias also cause ST segment depressions which typically occur in V4–V6 with a horizontal or slightly upsloping ST segment. These ST segment depression should resolve within minutes after termination of the tachycardia.
Ischemic ST depressions display a horizontal or downsloping ST segment (this is a requirement according to North American and European guidelines). The horizontal ST segment depression is most typical of ischemia (Figure 15 C). ST segment depressions with upsloping ST segments are rarely caused by myocardial ischemia. However, there is one notable exception, when an upsloping ST segment is actually caused by ischemia and the condition is actually alarming. Upsloping ST segment depressions which are accompanied by prominent T-waves in the majority of the precordial leads may be caused by acute occlusion of the left anterior descending coronary artery (LAD). This constellation – with upsloping ST depression and prominent T-waves in the precordial leads during chest discomfort – is referred to as de Winters sign (Figure 15 C).
Secondary ST depression
Secondary ST segment depressions occur in the following conditions:
- Left ventricular hypertrophy
- Right ventricular hypertrophy
- Left bundle branch block
- Right bundle branch block
- Pre-excitation
- Pacemaker stimulation in the (right) ventricle
These are all common conditions in which an abnormal depolarization (altered QRS complex) causes abnormalities in the repolarization (altered ST-T segment). For example, a block in the left bundle branch means that the left ventricle will not be depolarized via the Purkinje network, but rather via the spread of the depolarization from the right ventricle. The abnormal ventricular depolarization will cause abnormal repolarization. As evident from Figure 35 (panel D) these conditions are characterized by oppositely directed QRS- and ST-T-segments (recall that this is referred to as discordance). Hence, ECG leads with net positive QRS complexes will show ST segment depressions (as well as T-wave changes).
ECG changes in myocardial ischemia are discussed in section 3 (Acute & Chronic Myocardial Ischemia & Infarction) and a specific chapter discusses ST depression.
ST segment elevation
ST segment elevation is measured in the J-point. In the setting of chest discomfort (or other symptoms suggestive of myocardial ischemia) ST segment elevation is an alarming finding as it indicates that the ischemia is extensive and the risk of malignant arrhythmias is high. However, there are many other causes of ST segment elevations and for obvious reasons, one must be able to differentiate these. Figure 16 displays characteristics of ischemic and non-ischemic ST segment elevations. This figure must also be studied in detail.
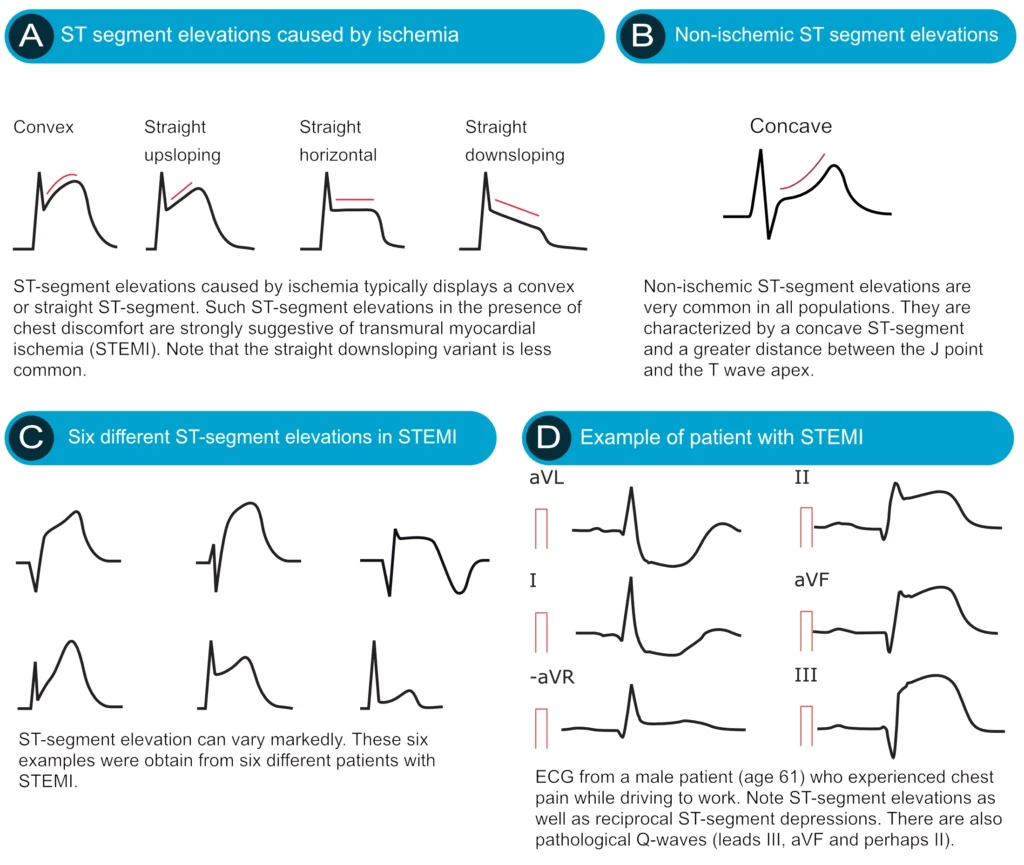
Ischemia typically causes ST segment elevations with straight or convex ST segments (Figure 16, panel A). The straight ST segment can be either upsloping, horizontal or (rarely) downsloping. Non-ischemic ST segment elevations are typically concave (Figure 16, panel B). Concave ST segment elevations are extremely common in any population; e.g ST segment elevation in leads V2–V3 occurs in 70% of all men under the age of 70. There is no definite way to rule out myocardial ischemia by judging the appearance of the ST segment, which is why North American and European guidelines assert that the appearance of the ST segment cannot be used to rule out ischemia. ECG changes in ischemia are discussed in detail in section 3 (Acute & Chronic Myocardial Ischemia & Infarction) and a specific chapter discusses ST elevation in detail.
The T-wave
Assessment of the T-wave represents a difficult but fundamental part of ECG interpretation. The normal T-wave in adults is positive in most precordial and limb leads. The T-wave amplitude is highest in V2–V3. The amplitude diminishes with increasing age. As noted above, the transition from the ST segment to the T-wave should be smooth. The T-wave is normally slightly asymmetric since its downslope (second half) is steeper than its upslope (first half). Women have a more symmetrical T-wave, a more distinct transition from ST segment to T-wave and lower T-wave amplitude.
The T-wave should be concordant with the QRS complex, meaning that a net positive QRS complex should be followed by a positive T-wave, and vice versa (Figure 17). Otherwise, there is discordance (opposite directions of QRS and T) which might be due to pathology. A negative T-wave is also called an inverted T-wave.
Log in to view image, video, quiz, text
T-wave changes are frequently misinterpreted, particularly inverted T-waves. Below follows a discussion that aims to clarify some of the common misunderstandings. All T-waves are illustrated in Figure 18.

Positive T-waves
Positive T-waves are rarely higher than 6 mm in the limb leads (typically highest in lead II). In the chest leads the amplitude is highest in V2–V3, where it may occasionally reach 10 mm in men and 8 mm in women. Usually, though, the amplitude in V2–V3 is around 6 mm and 3 mm in men and women, respectively. T-waves that are higher than 10 mm and 8 mm, in men and women, respectively, should be considered abnormal. A common cause of abnormally large T-waves is hyperkalemia, which results in high, pointed and slightly asymmetric T-waves. These must be differentiated from hyperacute T-waves seen in the very early phase of myocardial ischemia. Hyperacute T-waves are broad-based, high and symmetric. Their duration is short; they typically disappear within minutes after a total occlusion in a coronary artery occurs (then, of course, the ST segment will be elevated).
T-wave inversion (inverted / negative T-waves)
T-wave inversion means that the T-wave is negative. The T-wave is negative if its terminal portion is below the baseline, regardless of whether its other parts are above the baseline. T-wave inversions are frequently misunderstood, particularly in the setting of ischemia.
Normal T-wave inversion
An isolated (single) T-wave inversion in lead V1 is common and normal. It is generally concordant with the QRS complex (which is negative in lead V1). Isolated T-wave inversions also occur in leads V2, III or aVL. In any instance, one must verify whether the inversion is isolated, because if there is T-wave inversion in two anatomically contiguous leads, then it is pathological.
T-wave inversion in myocardial ischemia
Ischemia never causes isolated T-wave inversions. It is a general misunderstanding that T-wave inversions, without simultaneous ST-segment deviation, indicate acute (ongoing) myocardial ischemia. T-wave inversions without simultaneous ST-segment deviation are not ischemic! However, T-wave inversions that are accompanied by ST-segment deviation (either depression or elevation) is representative of ischemia (but in that scenario, it is actually the ST-segment deviation that signals that the ischemia is ongoing). Then one might wonder why T-wave inversions are included as criteria for myocardial infarction. This is explained by the fact that T-wave inversions do occur after an ischemic episode, and these T-wave inversions are referred to as post-ischemic T-waves. Such T-waves are seen after periods of ischemia, after infarction and after successful reperfusion (PCI).
Post-ischemic T-wave inversion is caused by abnormal repolarization. These T-wave inversions are symmetric with varying depth. They may be gigantic (10 mm or more) or less than 1 mm. Negative U-waves may occur when post-ischemic T-wave inversions are present. T-wave inversions may actually become chronic after myocardial infarction. Normalization of T-wave inversion after myocardial infarction is a good prognostic indicator. Please refer to Figure 37.
Secondary T-wave inversion
Secondary T-wave inversions – similar to secondary ST-segment depressions – are caused by bundle branch block, pre-excitation, hypertrophy, and ventricular pacemaker stimulation. T-wave inversions that are secondary to these conditions are typically symmetric and there is simultaneous ST-segment depression. Note that the T-wave inversion may actually persist for a period after the normalization of the depolarization (if it occurs). This is referred to as T-wave memory or cardiac memory. Secondary T-wave inversions are illustrated in Figure 19 (as well as Figure 18 D).
Log in to view image, video, quiz, text
Flat T-waves
T-waves with very low amplitude are common in the post-ischemic period. They are commonly seen in leads V1–V3 if the stenosis/occlusion is located in the left anterior descending artery. If the stenosis/occlusion is located in the left circumflex artery or right coronary artery, the flat T-waves are seen in leads II, aVF and III.
Biphasic (diphasic) T-waves
A biphasic T-wave has a positive and a negative deflection (Figure 37, panel C). It should be noted that the term “biphasic” is unfortunate because (1) biphasic T-waves carry no particular significance and (2) a T-wave is classified as positive or inverted based on its terminal portion; if the terminal portion is positive then the T-wave is positive and vice versa. Thus, a biphasic T-wave should be classified accordingly.
The T-waves in children and adolescents
The T-wave vector is directed to the left, downwards and to the back in children and adolescents. This explains why these individuals display T-wave inversions in the chest leads. T-wave inversions may be present in all chest leads. However, these inversions are normalized gradually during puberty. Some individuals may display persisting T-wave inversion in V1–V4, which is called persisting juvenile T-wave pattern. If all T-waves persist inverted into adulthood, the condition is referred to as idiopathic global T-wave inversion.
T-wave progression
T-wave progression follows the same rules as R-wave progression (see earlier discussion).
T-wave checklist
- I, II, -aVR, V5 and V6: should display positive T-waves in adults. aVR displays a negative T-wave.
- III and aVL: These leads occasionally display an isolated (single) T-wave inversion.
- aVF: positive T-wave, but occasionally flat.
- V1: Inverted or flat T-wave is rather common, particularly in women. The inversion is concordant with the QRS complex.
- V7–V9: should display a positive T-wave.
U-wave
A U-wave is occasionally seen after the T-wave. It is not known what engenders the U-wave. It is typically most prominent in leads V2–V3. young people, as well as athletes, have more prominent U-waves. Moreover, the U-wave is more prominent during slower heart rates. The height of the U-wave is typically one-third of the T-wave. Its first half is steeper than its second half.
U-wave inversion is rare but when seen, it is a strong indicator of pathology, particularly for ischemic heart disease and hypertension.
QT duration and corrected QT (QTc) duration
ECG interpretation always includes an assessment of the QT (QTc) duration. The QT duration represents the total time for de- and repolarization. It is measured from the beginning of the QRS complex to the end of the T-wave. Prolonged QT duration predisposes to life-threatening ventricular arrhythmias and therefore QT duration must always be assessed. Prolonged QT duration may either be congenital (genetic mutations, so-called long QT syndrome) or acquired (medications, electrolyte disorders). QT duration is inversely related to heart rate; QT duration increases at low heart rates and vice versa. Therefore one must adjust the QT duration for the heart rate, which yields corrected QT duration (Qtc). Bazett’s formula has traditionally been used to calculate the corrected QT duration. The formula follows (all variables in seconds):
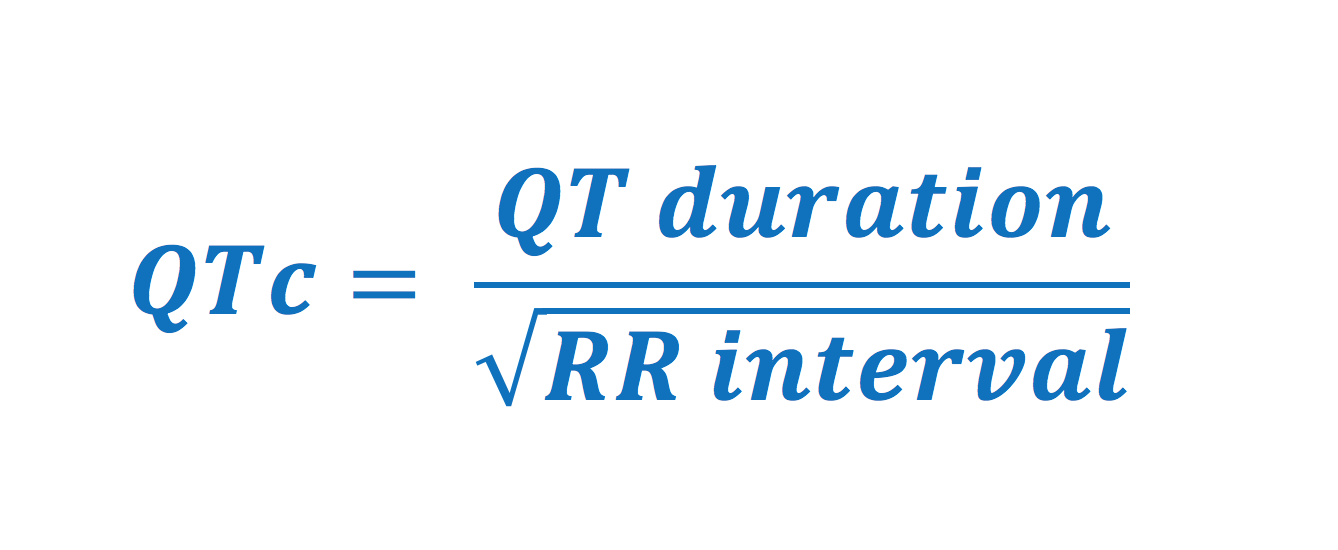
Normal values for QTc interval
- Men: <0,450 seconds
- Women: <0,460 seconds
However, Bazett’s formula is several decades old and has been questioned because it performs poorly at very low and very high heart rates. Newer formulas (which are incorporated in modern ECG machines) are to be preferred over Bazett’s formula. QTc duration is calculated automatically in all modern ECG machines. The result is based on the lead with the longest QTc duration (typically leads V2–V3).
Causes of prolonged QTc duration: antiarrhythmics (procainamide, disopyramide, amiodarone, sotalol), psychiatric medications (tricyclic antidepressants, SSRI, lithium, etc); antibiotics (macrolides, quinolones, atovaquone, chloroquine, amantadine, foscarnet, atazanavir); hypokalemia, hypocalcemia, hypomagnesemia; cerebrovascular insult (bleeding); myocardial ischemia; cardiomyopathy; bradycardia; hypothyroidism; hypothermia.
Short QTc syndrome (QTc <0,390 seconds) is uncommon and can be seen in hypercalcemia and during digoxin treatment. It is very rare but may cause malignant arrhythmias.
QT dispersion
The QT interval varies somewhat in the different leads. The difference between the shortest and the longest QT interval is the QT dispersion. Increased QT dispersion is associated with increased morbidity and mortality. This is presumably explained by a higher incidence of malignant ventricular arrhythmias. It has been suggested that the high risk of ventricular arrhythmias is due to the vulnerability caused by marked local differences in repolarization.
The electrical axis of the heart (heart axis)
Although often ignored, assessment of the electrical axis is an integral part of ECG interpretation. The electrical axis reflects the average direction of ventricular depolarization during ventricular contraction. The direction of the depolarization (and thus the electrical axis) is generally alongside the heart’s longitudinal axis (to the left and downwards). Figure 38 shows the coordinate system where the green area displays the range of the normal heart axis.
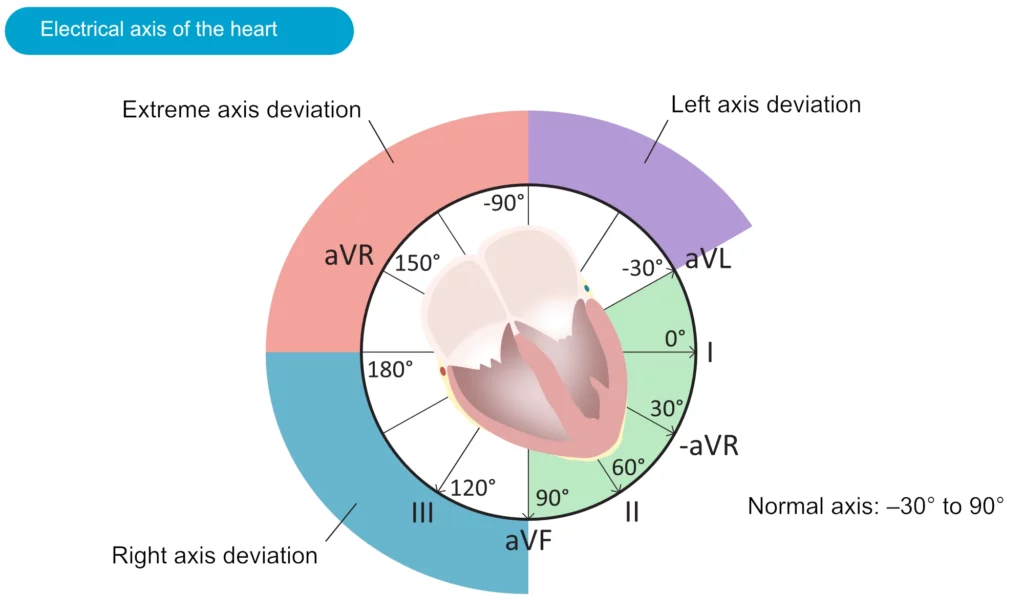
As evident from the figure, the normal heart axis is between –30° and 90°. If the axis is more positive than 90° it is referred to as right axis deviation. If the axis is more negative than –30° it is referred to as left axis deviation. The axis is calculated (to the nearest degree) by the ECG machine. The axis can also be approximated manually by judging the net direction of the QRS complex in leads I and II. The following rules apply:
- Normal axis: Net positive QRS complex in leads I and II.
- Right axis deviation: Net negative QRS complex in lead I but positive in lead II.
- Left axis deviation: Net positive QRS complex in lead I but negative in lead II.
- Extreme axis deviation (–90°to 180°): Net negative QRS complex in leads I and II.
Axis deviation: right axis deviation (RAD) and left axis deviation (LAD)
Causes of right axis deviation
Normal in newborns. Right ventricular hypertrophy. Acute cor pulmonale (pulmonary embolism). Chronic cor pulmonale (COPD, pulmonary hypertension, pulmonary valve stenosis). Lateral ventricular infarction. Pre-excitation. Switched arm electrodes (negative P and QRS-T in lead I). Situs inversus. Left posterior fascicular block is diagnosed when the axis is between 90° and 180° with rS complex in I and aVL as well as qR complex in III and aVF (with QRS duration <0.12 seconds), provided that other causes of right axis deviation have been excluded.
Causes of left axis deviation
Left bundle branch block. Left ventricular hypertrophy. Inferior infarction. Pre-excitation. Left anterior fascicular block is diagnosed if the axis is between -45° and 90° with qR complex in aVL and QRS duration 0,12 s, provided that other causes of left axis deviation have been excluded.
Causes of extreme axis deviation
Rare. Most likely due to misplaced limb electrodes. If the rhythm is tachycardia with wide QRS complexes, then ventricular tachycardia is the most likely cause.

