ECG in left ventricular hypertrophy (LVH): criteria and implications
ECG and clinical characteristics in left ventricular hypertrophy (LVH)
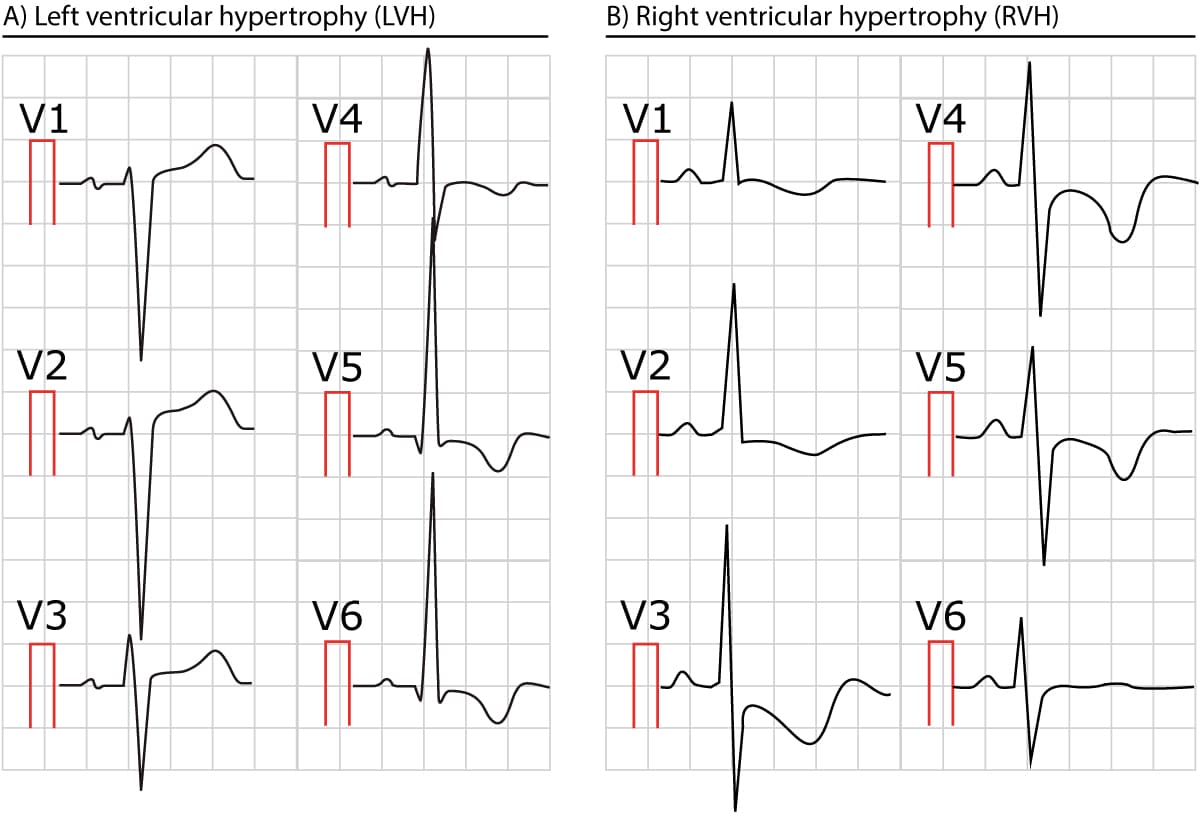
The following figure shows characteristic ECG changes in left ventricular hypertrophy (LVH) and right ventricular hypertrophy (RVH). Note that ventricular hypertrophy is primarily evident in the chest leads (V1, V2, V5 and V6), although leads aVL and I may show changes similar to those in V5 and V6.

Left ventricular hypertrophy (LVH)
The most common causes of left ventricular hypertrophy are aortic stenosis, aortic regurgitation, hypertension, cardiomyopathy and coarctation of the aorta. There are several ECG indexes, which generally have high diagnostic specificity but low sensitivity. These indexes were developed several decades ago but they are still in use in clinical practice. It should be noted that there are newer, more complicated, indexes that are utilized in modern ECG machines but the sensitivity and specificity are only negligibly better than the old indexes.
ECG criteria (index) for left ventricular hypertrophy (LVH)
Sokolow-Lyon criteria
- (RV5 or RV6) + (SV1 or SV2) > 35 mm or
- RaVL > 11 mm
Sokolow-Lyon’s index is the most used index, despite having the lowest sensitivity (20%) of all indexes. The specificity is high (>85%).
Cornell-voltage criteria
- Men: S(V3) + R(aVL) > 28mm
- Women: S(V3) + R(aVL) > 20 mm
Sensitivity 42%, specificity 95%
Cornell product criteria
- (RaVL+ SV3) • QRS duration > 2440 mVms
Presumably the best index. Sensitivity 51%, specificity 95%.
Romhilt-Este’s index
Romhilt-Este’s index, which is point-based, has been reported to have a sensitivity of 60%. 4 points make LVH probable. 5 points make LVH very likely.
| Romhilt-Este’s score system | Points |
| Any of the following: R or S in any limb lead ≥20 mm SV1 or SV2 ≥30 mm RV5 or RV6 ≥30 mm | 3 |
| Discordant ST-T change in a patient not on digoxin treatment | 3 |
| Discordant ST-T change in a patient on digoxin treatment | 1 |
| ECG signs of left atrial enlargement | 3 |
| Left axis deviation | 2 |
| QRS duration ≥90 milliseconds | 1 |
| Prolonged R-wave peak time: V1-V2 (right ventricle): ≥35 milliseconds V5-V6 (left ventricle): ≥45 milliseconds | 1 |
ECG changes in left ventricular hypertrophy (LVH)
- Large R-waves in left-sided leads (V5, V6, I and aVL) and deep S-waves in right-sided leads (V1, V2) indicate that the vector of the left ventricle is amplified.
- Secondary ST-T changes in left-sided leads – Left ventricular hypertrophy is often accompanied by J point depression, downsloping ST segment and inverted (asymmetric) T-waves in the left-sided leads. It is typical that the ST-segment bulges upwards (Figure 1 and 2) in these leads. These ECG changes were previously referred to as strain pattern because it was believed that they indicated left ventricular exhaustion. However, this term is not in use anymore because it has been shown that such ECG changes also occur in conditions where the left ventricle is not overloaded (e.g. dilated cardiomyopathy, hypertrophic cardiomyopathy). Therefore, the term secondary ST-T changes should be preferred.
- Secondary ST-T changes in right-sided leads – ST-segment elevation is common in leads V1 and V2. The ST segment is typically slightly concave (Figures 1 and 2).
- Prolonged QRS duration – Because it takes a longer time to depolarize a larger myocardial mass, the QRS duration may be slightly prolonged. For the same reason, R-wave peak time may also be prolonged. This prolongation may also be due to myocardial fibrosis which is typical in hypertrophy. Finally, the QRS complex may be notched.
- P mitrale – Left atrial enlargement (P mitrale) may develop because LVH affects the hemodynamics of the left atrium.
- Left axis deviation – is common in LVH.
- QT prolongation – A slight prolongation of the QT (QTc) interval is frequently seen.
QRS amplitude is not reliable to detect left ventricular hypertrophy
All indexes are based partly on QRS amplitudes which may appear logical but it is actually a rather unreliable variable because it is affected by a range of factors not related to ventricular mass. Body configuration is the most obvious factor. Lean individuals tend to have a shorter distance between the heart and the electrodes, which therefore record the signals as stronger (as compared with an obese individual). The distance between the heart and the electrodes is greater in obese individuals, as well as those with chronic obstructive pulmonary disease (COPD, due to hyperinflation of the chest). Age is also important because QRS amplitudes diminish naturally with increasing age. Hence, young individuals have greater QRS amplitudes and some experts suggest that no index should be used in individuals aged less than 35 years. Moreover, athletes will often have large QRS amplitudes due to their ventricular remodeling, but they do not have pathological hypertrophy. Finally, women have lower QRS amplitudes than men.

