Evaluation of exercise stress test: ECG, symptoms, blood pressure, heart rate, performance
Evaluation of the exercise stress test (exercise ECG)
- Symptom during exercise stress testing
- 2. Exercise performance (functional capacity, exercise capacity)
- 3. Heart rate response during exercise stress testing
- 4. Blood pressure response during exercise stress testing
- 3. ECG reaction
- Complete results from an exercise test: clinical case
- Evaluating ST depression in relation to heart rate: frequency adjusted ST depressions
- ST segment elevation during exercise stress testing
- Arrhythmias occurring during exercise stress testing
- Conduction defects (disturbances) during exercise stress testing
The ECG reaction has always been a central component of the exercise stress test. Indeed, clinicians often use the term exercise ECG instead of the correct term exercise stress test. However, the ECG is only one of the parameters that must be evaluated and the final result of the test depends on an integrated assessment of six components:
- Symptoms
- Exercise performance (functional capacity, exercise capacity)
- Heart rate: maximal heart rate, heart rate response
- Blood pressure reaction
- ECG reaction: ST changes, T-wave changes, arrhythmias, conduction defects
- Cause of termination
This article will discuss each of these six parameters in detail.
Symptom during exercise stress testing
Perceived exertion
The patient’s perceived exertion is a way of estimating the intensity of the physical activity. It is based on the subjective physical sensations experienced during exercise, including increased heart rate, increased respiratory rate and depth, increased sweating, and muscle fatigue. Although this is a subjective measure, it provides a fairly good estimate of the actual workload. The perceived exertion may be graded from 0 (none) to 10 (maximal exertion) or according to the Borg scale. The Borg scale is well validated at ranges from 6 (none) to 20 (maximal exertion). Notably, a high perceived exertion at a low workload is a strong predictor of adverse outcomes.
Table 1. Borg Rating of Perceived Exertion Scale
| RATING | LEVEL OF EXERTION | COMMENT |
|---|---|---|
| 6 | No exertion at all | |
| 7 | ||
| 7.5 | Extremely light exertion | |
| 8 | ||
| 9 | Very light exertion | For a healthy person, 9 is equivalent to walking slowly at his or her own pace for some minutes. |
| 10 | ||
| 11 | Light exertion | |
| 12 | ||
| 13 | Somewhat hard exertion | “Somewhat hard” exercise, but it still feels OK to continue. |
| 14 | ||
| 15 | Hard (heavy) exertion | |
| 16 | ||
| 17 | Very hard exertion | A healthy person can still go on, but he or she really has to push him- or herself. It feels very heavy, and the person is very tired. |
| 18 | ||
| 19 | Extremely hard exertion | For most people this is the most strenuous exercise they have ever experienced. |
| 20 | For most people, this is the most strenuous exercise they have ever experienced. |
There is a strong correlation between a person’s perceived exertion rating times 10 and the actual heart rate during exercise; so a person’s exertion rating provides an estimate of the actual heart rate. For example, if the perceived exertion is 12, then 12 x 10 = 120; so the heart rate should be about 120 beats per minute.
Chest pain (chest discomfort)
Chest pain during exercise is one of the strongest predictors of coronary artery disease. The severity of the pain may be graded from 0 (none) to 10 (maximal pain). It is important to clarify whether the pain provoked by exercise is similar to the pain that leads to the stress test (if that was the reason for conducting the test). Chest pain rated as 6 or above (according to the 10-point scale) should prompt termination of the stress test (refer to Termination criteria during stress testing).
Dyspnea (dyspnoea)
Exercise does lead to tachypnea (increased respiratory rate), which should, however, be distinguished from dyspnea which is shortness of breath. Dyspnea may be due to poor exercise capacity (with normal ventilatory capacity and cardiac output), diminished ventilatory capacity, diminished cardiac output or an angina equivalent. Note that women, diabetics and older individuals with coronary artery disease may only present with dyspnea (which is then considered an angina equivalent). Notably, terminating the test due to dyspnea is associated with a worse prognosis than termination due to chest pain.
Leg fatigue
Leg fatigue is particularly pronounced on bicycle, and less pronounced on the treadmill. Leg fatigue is, as compared with chest pain and dyspnea, a poor predictor of cardiovascular and all-cause mortality. However, leg fatigue must be registered.
2. Exercise performance (functional capacity, exercise capacity)
Exercise performance is probably the single best predictor of risk for future adverse events in healthy individuals, those at increased risk for cardiovascular disease, and actually all patient populations. This is true independent of other traditional risk factors. The correlation between exercise capacity and survival is almost linear, meaning that survival increases along with increased exercise capacity.
Performance is estimated using the maximal heart rate, rate pressure product, duration of the test, and the patient’s perceived exertion rating. The combined results of these parameters indicate the patient’s exercise capacity. For example, if the patient reaches the age-expected maximal heart rate, a high rate-pressure product, and endures the entire test without rating it as extremely hard, he or she has an excellent exercise performance. The inability to reach 85% of the age-expected maximal heart rate is associated with an increased risk of cardiovascular and overall mortality. Coronary artery disease, sinus node dysfunction (chronotropic incompetence), heart failure, left ventricular dysfunction, poor physical fitness, pulmonary disease etc are common causes. Note that some patients may perform well below their actual capacity without any medical explanation; it is important to motivate the patient before and throughout the test so that he or she performs maximally.
3. Heart rate response during exercise stress testing
Please refer to the previous paragraph.
4. Blood pressure response during exercise stress testing
Systolic blood pressure must exceed 140 mmHg during the test. Systolic blood pressure >200 mmHg may indicate an abnormal blood pressure reaction, which is typically seen in patients with hypertension as well as normotensive patients who will eventually develop hypertension.
A fall in blood pressure during the test indicates coronary artery disease or cardiomyopathy. The blood pressure may drop gradually as the workload is increased, or it may drop after an initial (normal) increase in blood pressure. Both scenarios are pathological. The test should be terminated if blood pressure drops 10 mmHg or more and there are other signs of ischemia. Termination of the test should always be considered when blood pressure drops 10 mmHg or more.
3. ECG reaction
ST segment depressions during exercise stress test
The myocardial ischemia that can be provoked by exercise is located in the subendocardium of the left ventricle. As discussed previously (refer to ST segment depression in ischemia), subendocardial ischemia redirects the ST vector such that it becomes directed from the epicardium to the endocardium, which means that the ST vector will be directed towards the back (Figure 1). Hence, the ST vector is directed away from all chest leads (V1, V2, V3, V4, V5, V6). Chest leads that detect this ST vector will display ST segment depressions (because the ST vector heads away from these leads). However, leads with ST segment depressions do not necessarily reflect the ischemic area; e.g. ST segment depressions in leads V3 and V4 do not necessarily imply that the ischemia is located anteriorly.
The T-wave vector may similarly be directed towards the back which yields a negative T-wave (T-wave inversion). However, the primary ECG manifestation of myocardial ischemia (during exercise) is the ST segment depression and not the T-wave inversion. Myocardial ischemia does not manifest only with T-wave inversions during exercise; if there are T-wave inversions during ischemia, there will always be ST segment depressions as well. The ST segment, on the other hand, can be depressed (during ischemia) without simultaneous T-wave inversion. In summary:
- ST segment depression is the hallmark of myocardial ischemia (during exercise) on the ECG.
- ST segment depression may be isolated or accompanied by T-wave inversions (negative T-waves).
- T-wave inversion (negative T-waves) never appears without simultaneous ST depression in patients with myocardial ischemia.
Figure 1 illustrates how subendocardial ischemia generates ST vectors that lead to ST depression and inverted T-waves.

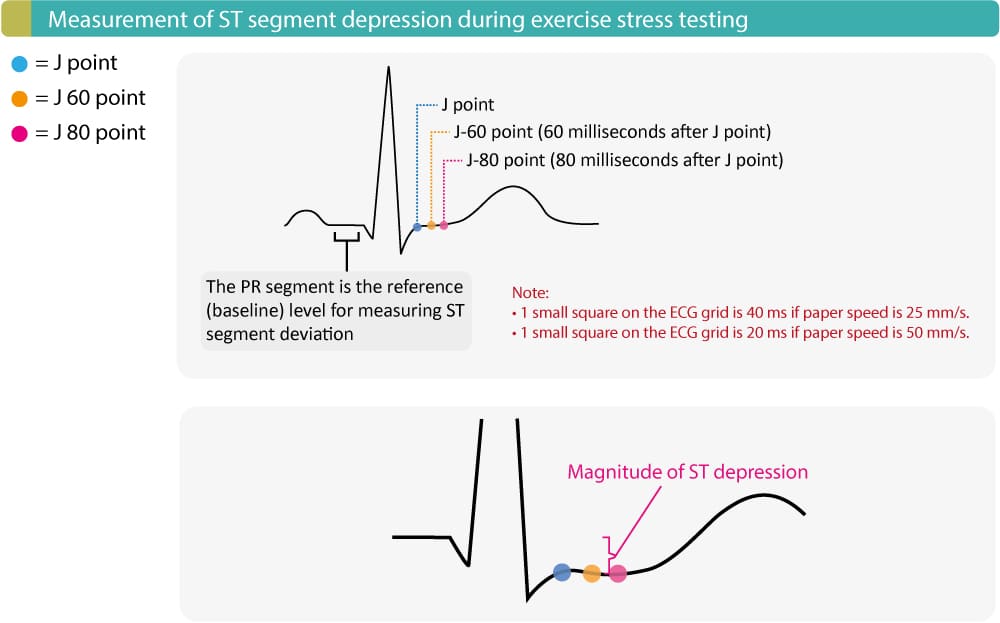
Measuring ST depression: J point, J 60 point & J 80 point
ST segment depression is measured anywhere between the J-60 point and J-80 point. The J-60 point and J-80 point are located 60 ms and 80 ms, respectively, after the J point (Figure 2). As usual, the PR segment is the reference (baseline) level. The magnitude of the ST depression is simply the difference (in millimeters) between the PR segment and the J-60/J-80 point.
Study Figure 2 (below) carefully, as it illustrates the J point, J 60 point, J 80 point, and the baseline to which these points are compared.
Types of ST segment depressions
ST segment depressions may be characterized as (1) J point depressions, (2) upsloping ST depressions, (3) horizontal ST depressions, or (4) downsloping ST depressions. These types are illustrated in Figures 3 and 4. Myocardial ischemia causes ST segment depressions with horizontal or downsloping ST segments, which is illustrated in Figure 3. The depression should be 1 mm or more in the J-60 point or J-80 point (or anywhere between). 1 mm ST depression provides a sensitivity of 70% and specificity of 80% for coronary artery disease. The deeper the ST depression, the greater sensitivity and specificity.
- Myocardial ischemia is diagnosed if there is ≥1 mm horizontal or downsloping ST depression in J-60/J-80 point (or between J-60 and J-80).
The typical ischemic ST depression is illustrated in Figure 3, below.

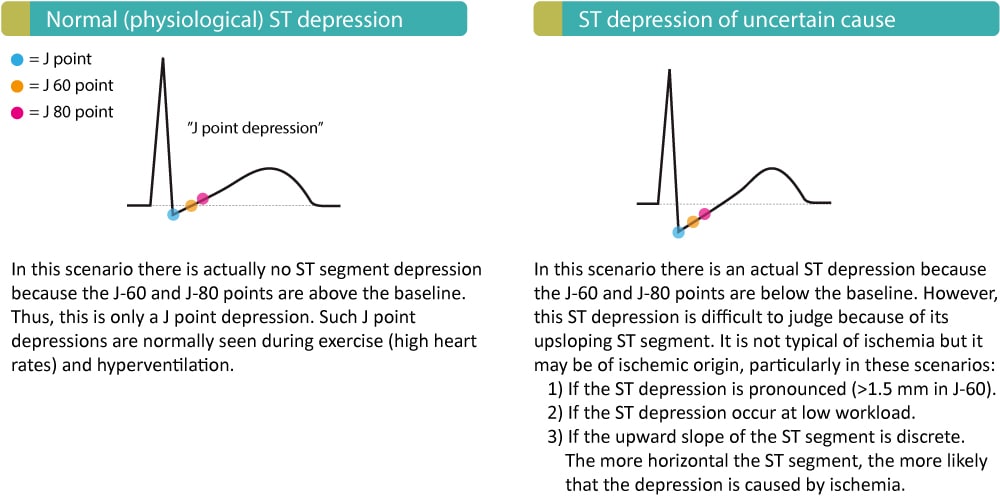
Non-ischemic ST segment depressions
Approximately 20% of healthy individuals exhibit upsloping ST depression during exercise stress testing. Upsloping ST depressions are thus very common during exercise and they are not typical of myocardial ischemia. If only the J point is depressed (Figure 4, left panel), then it is referred to as J point depression. J point depression is normal during exercise and it is not a diagnostic problem because there is no actual ST depression. In summary, J point depression is not caused by ischemia.
The right panel of Figure 4 shows an upsloping ST depression with a depressed J-60 point and J-80 point. Such ST depressions are also common during exercise and situations with tachycardia. These ST depressions do, however, cause differential diagnostic problems, because in a minority of cases they are caused by ischemia. The following characteristics suggest that upsloping ST depressions may be of ischemic origin:
- If the ST depression is very pronounced (≥1.5 mm)
- The smaller the inclination of the slope, the more likely is ischemia.
- The steeper the slope the less likely is ischemia.
- The more horizontal the slope the more likely is ischemia.
- If the ST depression appears at low workload then ischemia should be considered.
Nevertheless, in the majority of cases, the upsloping ST depressions are not caused by ischemia. Non-ischemic ST depressions are illustrated in Figure 4, below.
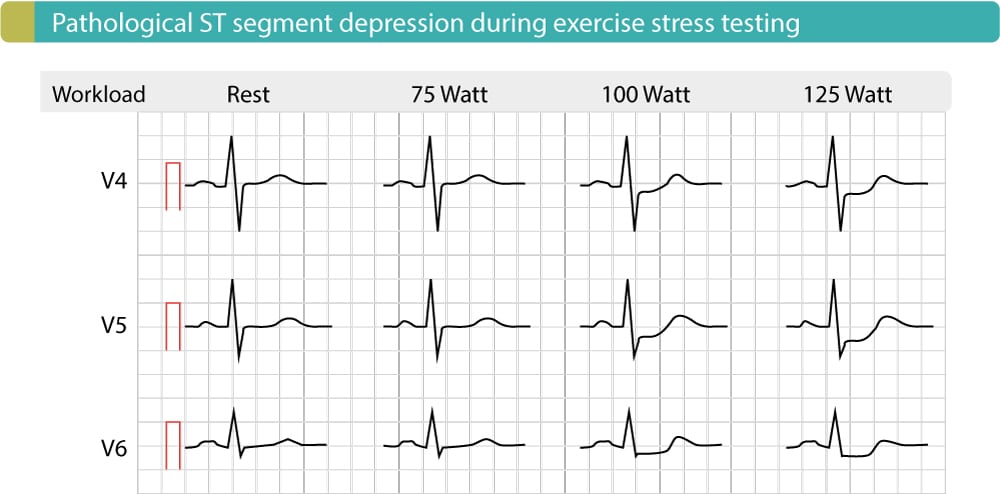
ECG leads to detect ischemia
ECG leads V4, V5 and V6 are the best leads to detect ischemia during exercise. These leads have the highest sensitivity for myocardial ischemia, which means that the probability of detecting ischemia is highest in these leads. The limb leads are less sensitive in terms of detecting ischemia. However, ST segment depressions in lead -aVR suggest severe myocardial ischemia (multivessel disease or left main disease).
If ST segment depressions occur early in the test, or if ST depressions are pronounced, or if ST depressions occur in many ECG leads, then there is probably extensive myocardial ischemia. The probability of multivessel disease increases with the number of leads showing ST segment depressions. Moreover, ST depressions with long duration during the recovery period also suggest more severe coronary artery disease.
Note that some patients only display ST depression during the recovery period. This is explained by the fact that myocardial workload increases once the patient is placed in the supine position (the preload of the heart increases because of increased venous return in a supine position).
Figure 5 (below) illustrates the ECG reaction of a male with coronary artery disease.
To distinguish normal (physiological) ST depressions from ischemic ST depressions, the following rules are suggested:
- Normal (physiological) upsloping ST depressions only occur at high heart rates. Upsloping ST depressions due to ischemia occur already at low heart rates.
- Normal (physiological) upsloping ST depressions are rapidly normalized during the recovery period. Upsloping ST depressions due to ischemia are slow to normalize during the recovery period.
- Normal (physiological) upsloping ST depressions have a steeper slope than ischemic ST depressions.
- Normal (physiological) upsloping ST depressions rarely exceed 1.5 mm.
Patients with ST depressions on resting ECG
In patients with ST segment depressions on resting ECG (e.g. due to left ventricular hypertrophy), the ST depression is measured from the initial level (at rest) of the J-60/J-80 point (and not from the level of the PR segment). Moreover, if there are ST depressions at rest, additional ST depression induced by exercise will not be as specific to ischemia as is otherwise the case (unless the depressions are very pronounced).
Atrial repolarization may mimic ST depression
Atrial repolarization occurs simultaneously with ventricular depolarization (QRS complex), which generates stronger electrical potentials and therefore conceals atrial repolarization. Occasionally during exercise, atrial repolarization may become visible and create a negative wave just after the QRS complex. This may imitate an ST segment depression, particularly in the inferior leads.
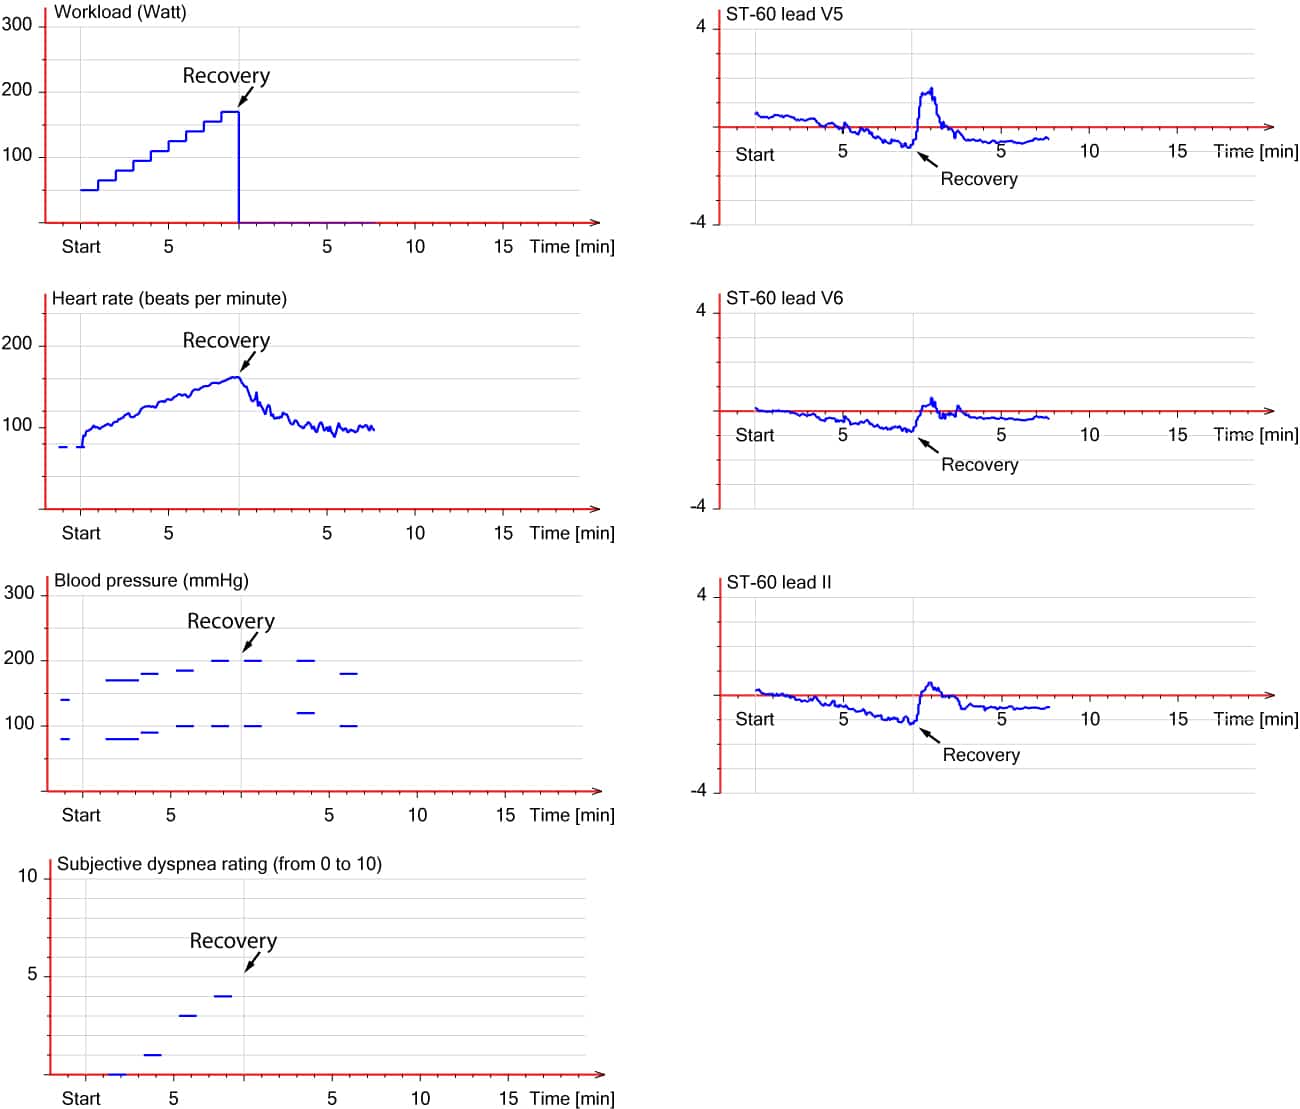
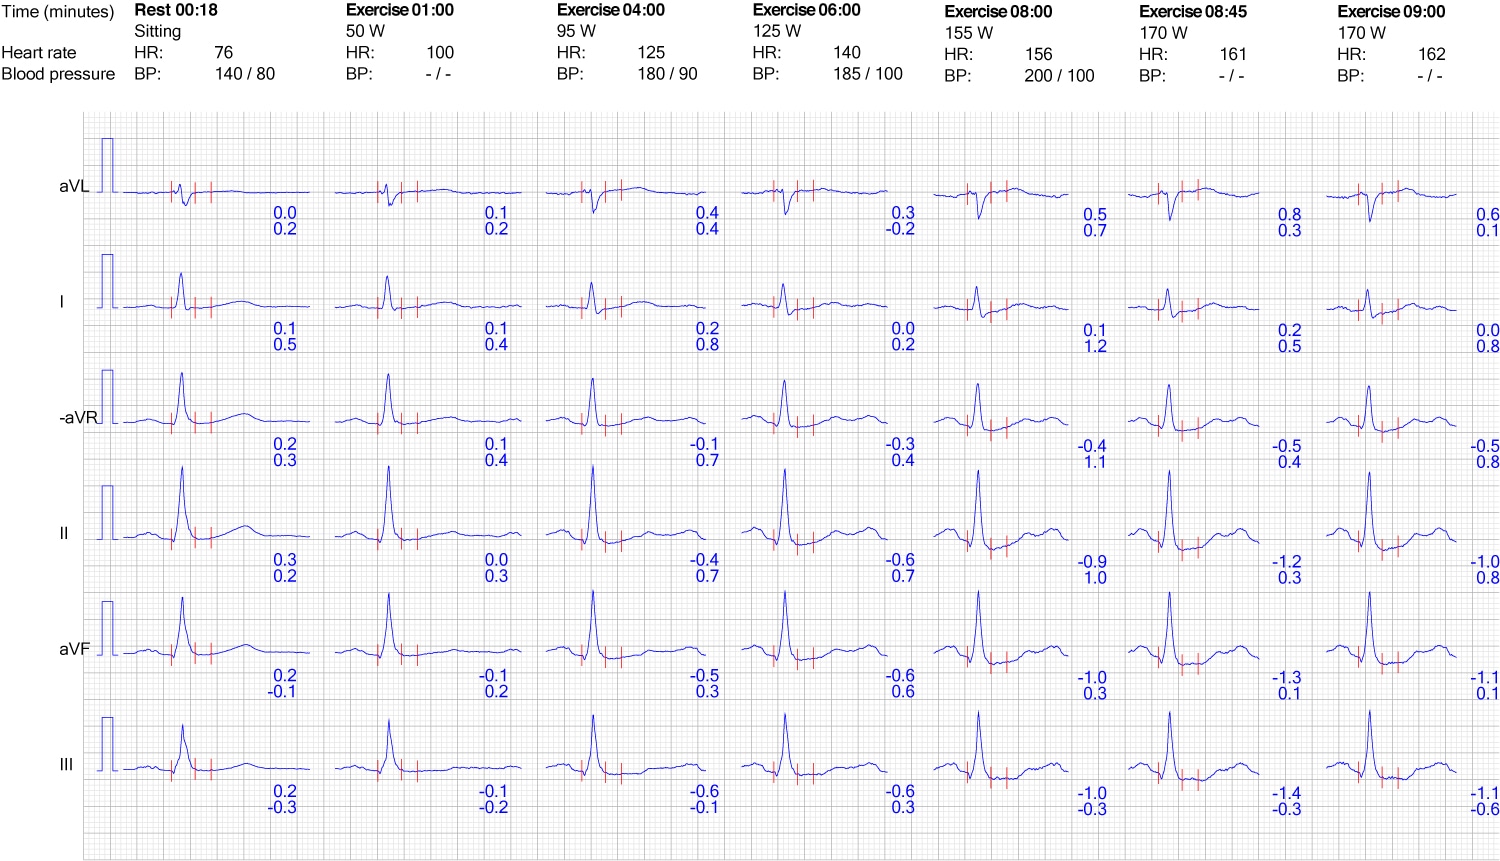
Complete results from an exercise test: clinical case
A 58-year-old male was admitted to the emergency room due to chest discomfort. He had experienced chest discomfort almost daily during the past few months. His resting 12-lead ECG was normal, as were laboratory tests, including troponin T. The exercise stress test revealed myocardial ischemia (results below). The patient underwent coronary artery bypass grafting (CABG) due to left main disease. Below are all the test results.
1. Overview of test results
2. ECG reaction in the limb leads

3. ECG reaction in chest (precordial) leads


Evaluating ST depression in relation to heart rate: frequency adjusted ST depressions
Some experts emphasize that heart rate must be taken into consideration when judging ST segment depressions. Taking heart rate into account may actually facilitate differentiating normal (physiological) ST segment depressions from ischemic ST segment depressions. The rationale for this is as follows:
- Healthy individuals often achieve high heart rates which may induce normal (physiological) ST depressions (typically with an upsloping ST segment) that are not caused by ischemia. Approximately 20% of healthy subjects display ST depression during exercise testing.
- Patients with coronary artery disease frequently fail to achieve sufficient workload (heart rate) to provoke myocardial ischemia. The ST depressions may not reach the criteria of 1 mm because of insufficient workload.
Thus, adjusting the magnitude of the ST depression to the heart rate may be a reasonable approach. ST depressions occurring at high heart rates are given less significance, while ST depressions occurring at low heart rates are given more significance. The adjustment can be made by either the ST/HR index or ST-HR slope.
The ST/HR index
The magnitude of the ST depression (in mV, where 0.1 mV = 1 mm) is divided by the heart rate increase during the test. An example follows:
- Maximal ST depression during the test is 2 mm, which equals 0.2 mV.
- The heart rate increased from 70/min (at rest) to 170/min (at maximal workload), which equals an increase of 100/min.
- HR index = 0.2 / 100 = 0.002 mV/beat/minute
An HR index above 0.0016 mV/beat/minute suggests myocardial ischemia.
ST-HR slope
This parameter is calculated automatically in most ECG machines. It is the slope of the linear association between the heart rate and the amplitude of the ST depression. An ST-HR slope greater than 2.4 mV/beat/minute is significant.
ST segment elevation during exercise stress testing
ST segment elevation during exercise stress testing is measured in the J-60 point (whereas ST elevation is measured in the J-point on the resting ECG). In patients with ST elevations on the resting ECG (e.g. male pattern, early repolarization, left ventricular hypertrophy, etc), any additional ST elevation induced by exercise is measured from the initial level of the J-60 point (and not the level of the PR segment).
The implication of ST elevations during exercise depends on whether they occur in leads with or without pathological Q-waves.
ST elevation in leads without pathological Q-waves
ST elevations in leads without pathological Q-waves are rare during exercise stress testing. Such ST elevations indicate transmural ischemia, i.e. ischemia that affects the entire thickness (from endocardium to epicardium) of a myocardial region. This type of ischemia requires a (more or less) complete obstruction of blood flow, which may be explained by the following:
- Acute coronary syndrome (rupture of an atherosclerotic plaque) emerges during the test. The thrombosis caused by plaque rupture may occlude the artery completely.
- Presence of a severe and proximal stenosis (>90% luminal obstruction).
- Coronary artery vasospasm.
Importantly, the stress test must be terminated if ST segment elevations occur in leads without pathological Q-waves.
ST elevations in leads with pathological Q-waves (previous myocardial infarction)
ST elevations may occur in leads with pathological (infarction) Q-waves. Such ST elevations may be caused by the following conditions:
- Residual ischemia in the infarct area
- Left ventricular aneurysm
- Wall motion abnormalities
Reciprocal ST depression may be evident in each of these cases. If transmural ischemia cannot be ruled out, then the test must be terminated.
Psuedonormalization of ST-T changes
ST depressions and T-wave inversions that are present during rest but disappear during exercise indicate an abnormal reaction. If the patient has a high pre-test probability, this should lead to suspicion of myocardial ischemia.
Other morphological ECG changes
- The PR interval and QRS duration are shortened during exercise (normal reaction).
- Septal q-waves in leads I, aVL, V5, V6 may be accentuated during exercise (normal reaction).
- The R-wave amplitude may decrease during exercise (normal reaction).
- T-wave amplitude may decrease or increase (during heavy workload) during exercise, both of which are normal reactions.
- QT duration is shortened by exercise (normal reaction).
- If U-waves are evident on resting ECG and become inverted during exercise, it suggests myocardial ischemia.
Arrhythmias occurring during exercise stress testing
Supraventricular and ventricular arrhythmias may occur during exercise. This is more common in persons taking digoxin (digitalis) and those with coffee or alcohol in their blood. The subendocardial ischemia induced by exercise rarely induces any serious arrhythmias. In fact, exercise may actually suppress arrhythmias that are present at rest. For example, ectopic atrial arrhythmias may be suppressed when the sinoatrial node accelerates its discharge frequency; ventricular extrasystoles (premature beats) may also be suppressed during exercise. This has no prognostic implication.
Sinus arrhythmia and sinus bradycardia may occur during or after exercise. Atrial fibrillation and atrial flutter occur in 0.1% of all tests.
The only exercise-induced arrhythmia that is related to coronary artery disease is ventricular tachycardia (VT). Ventricular extrasystoles are common during exercise and they have no prognostic implication (ventricular extrasystoles are harmless unless there is electrical instability in the ventricles).
Conduction defects (disturbances) during exercise stress testing
Bundle branch block and fascicular block may occur during exercise. Left bundle branch block (LBBB) indicates underlying heart disease, particularly ischemic heart disease. Right bundle branch block (RBBB) may also occur, even in healthy individuals and it is not considered a sign of heart disease.
Atrioventricular (AV) block is uncommon during exercise, with the exception of first-degree AV block which is frequently seen during the recovery period (return of Vagal activity). Any degree of AV block during exercise and high-degree AV block (second-degree AV block or third-degree AV block) in the recovery period suggest ischemic heart disease.
The recovery period
Occasionally, ST segment depressions are only seen during the recovery period (the preload of the heart increases in the supine position). The duration of the recovery period is 6 to 8 minutes, during which the patient must be monitored. The test is completed when all parameters have returned to their baseline values.

