ST segment elevation in acute myocardial ischemia and differential diagnoses
ST segment elevation in acute myocardial ischemia
- 1. Male/female pattern (“Normal ST segment elevation”).
- 2. Early repolarization
- 3. Left ventricular hypertrophy (LVH)
- 4. Left bundle branch block (LBBB)
- 5. Acute perimyocarditis (myocarditis)
- 6. Hyperkalemia
- 7. Brugada syndrome
- 8. Arrhythmogenic right ventricular cardiomyopathy/dysplasia (ARVC/D)
- 9. Pre-excitation & WPW (Wolff-Parkinson-White syndrome)
- 10. Electrical cardioversion
- 11. Takotsubo cardiomyopathy (broken-heart syndrome, apical ballooning syndrome, stress-induced cardiomyopathy)
- 12. Prinzmetal’s angina (variant angina, coronary artery vasospasm)
- 13. Pulmonary embolism
- 14. Hypothermia & hypercalcemia
- 15. Proximal aortic dissection
- 16. Left ventricular aneurysm
ST segment elevations with straight (horizontal, upsloping, or downsloping) or convex ST segment strongly suggest acute transmural ischemia (Figure 1 A). Concave ST segment elevations, on the other hand, are much less likely to be caused by ischemia (Figure 1 B). This is noted in both North American and European guidelines. However, a concave ST segment does not rule out ischemia, it merely reduces the probability of ischemia as the underlying cause. Concave ST segment elevations are very common in the population (discussed below). Study Figure 1 carefully.

Current guideline criteria for ischemic ST segment elevation:
New ST segment elevations in at least two anatomically contiguous leads:
• Men age ≥40 years: ≥2 mm in V2-V3 and ≥1 mm in all other leads.
• Men age <40 years: ≥2,5 mm in V2-V3 and ≥1 mm in all other leads.
• Women (any age): ≥1,5 mm in V2-V3 and ≥1 mm in all other leads.
• Men & women V4R and V3R: ≥0,5 mm, except from men <30 years in whom the criteria is ≥1 mm.
• Men & women V7-V9: ≥0,5 mm.
The ST segment elevations in ischemia are dynamic. A patient may initially present with ST segment elevations that do not fulfill the ECG criteria, only to develop magnificent ST segment elevations a few minutes later. Indeed, a dynamic (varying) ST segment is suggestive of myocardial ischemia. It is wise to connect the patient to continuous ECG (ST) monitoring in order to detect such dynamics.
ST segment elevations with concave ST segment
Concave ST segment elevations pose a diagnostic challenge (Figure 1 B). Such ST segment elevations are extremely common in all populations. They occur in young, old, healthy and diseased individuals. For example, roughly 90% of males aged <30 years display concave ST segment elevations in leads V2–V3. This explains why guidelines require higher ST segment elevations in these leads (see criteria above). However, one must be careful. There are plenty of cases of transmural ischemia presenting with concave ST elevations. Moreover, the ST segment may have a concave appearance if the T-wave is prominent (such as in hyperkalemia, early repolarization or even early phases of ischemia). To conclude, concave ST segment elevation is atypical of ischemia, but they do not rule out ischemia.
Other features of ischemic ST segment elevations
In STE-ACS (STEMI) the level of the J point is typically close to the level of the T-wave apex (i.e the height difference between the J point and the apex of the T-wave is typically small). Moreover, ischemic ST segment elevations are typically accompanied by reciprocal ST segment depressions. These ST segment depressions are mirror images of the ST segment elevations, and they are seen in leads with a roughly opposite angle to the leads with ST elevations. Importantly, reciprocal ST segment depressions strongly suggest transmural ischemia. This is also consistent with the vector theory; elevation in one lead should be recorded as depression in a lead with an opposite angle of observation. However, reciprocal ST segment depressions may be missing. There are three explanations as to why reciprocal ST segment depressions may be absent:
- There is no ECG lead with the opposite angle of observation.
- The injury currents are not strong enough to be detected on leads with opposite angle of observation.
- Other vectors may interfere with the injury currents, and inhibit them from being detected by leads with opposite angles of observation.
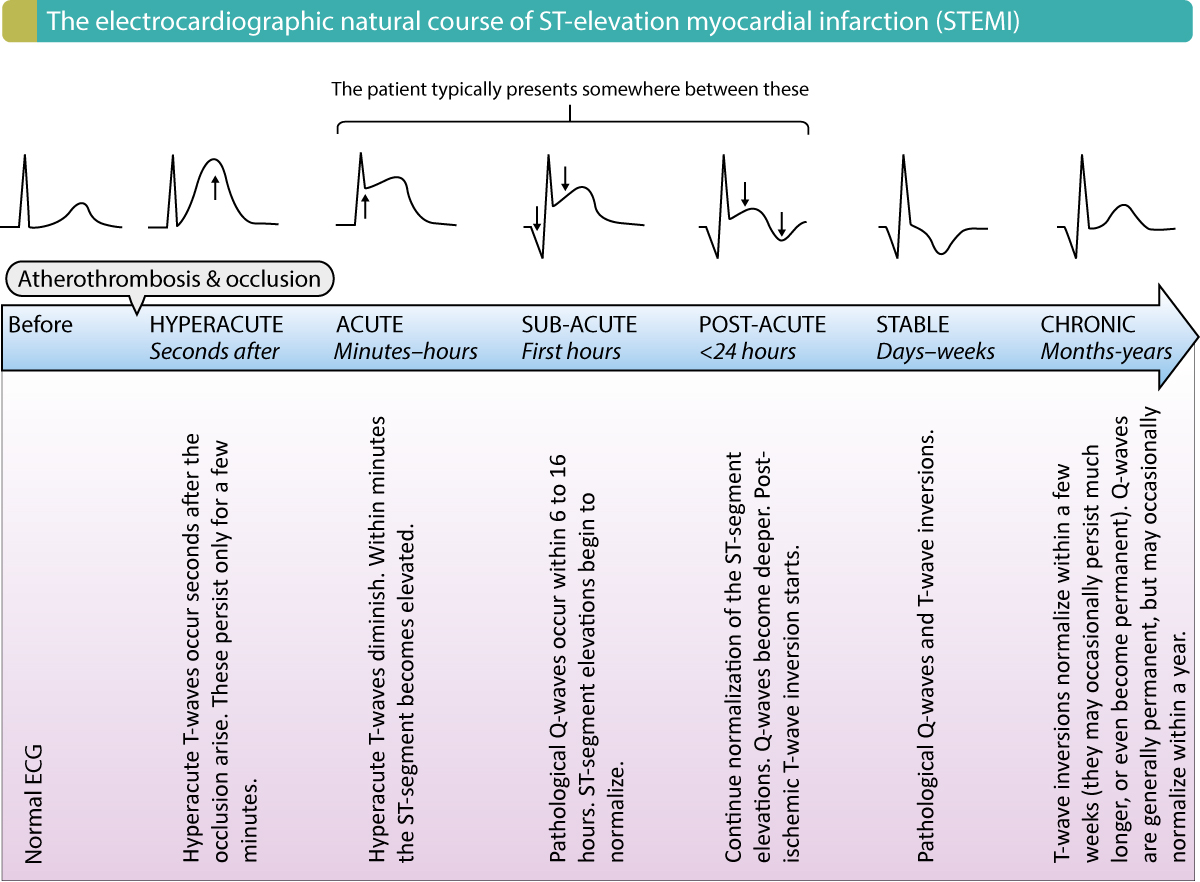
The electrocardiographic natural course of STE-ACS (STEMI)
Figure 2 presents the entire electrocardiographic (ECG) development in STE-ACS/STEMI. Note that a patient with STEMI may present during any of the phases illustrated in this figure, which is why it should be studied in detail.
Pitfalls
Acute transmural ischemia located in the basal portions of the lateral wall of the left ventricle (referred to as the posterolateral wall) does not result in ST segment elevations on the conventional 12-lead ECG, simply because none of the leads are able to detect these injury currents. Instead, reciprocal ST segment depressions appear in the anterior chest leads (V1–V3). Similarly, acute transmural ischemia located in the right ventricle is frequently missed when only using the standard leads. In order to correct this, one may connect right-sided chest leads V4R and V5R. For details, refer to STEMI (STE-ACS) Without ST Segment Elevations.
Log in to view image, video, quiz, text

Differential diagnoses to ST segment elevations
This section is of paramount importance to anyone seeing patients who may have heart disease. Every physician, nurse and paramedic should be able to confidently differentiate 15 different causes of ST segment elevations, which is why a detailed presentation follows. Each differential diagnosis is discussed separately, starting with the most common form of ST segment elevation, namely male/female pattern.
1. Male/female pattern (“Normal ST segment elevation”).
Male/female pattern is by far the most common type of ST segment elevation. It is completely benign and no study to date has associated this pattern with any increased risk of cardiovascular or all-cause mortality. The prevalence has been examined thoroughly in males (particularly in the US arm), which is why it is usually referred to as male pattern, but it is also common in females. Nevertheless, studies show that among males aged 16 to 58 years, roughly 90% display ≥1 mm ST segment elevation in ≥1 chest lead. The prevalence declines to 30% among males aged 70 years or above. In females, on the other hand, the prevalence is steady throughout the age span, being approximately 20%. It is a blatant, but a far too common mistake (even among cardiologists and electrophysiologists) to confuse male/female pattern with early repolarization.
ECG characteristics of male/female pattern
A representative ECG example is presented in Figure 4.
- The ST segment elevations are most pronounced in leads V2–V4, where they might reach 3 mm, or even more. Women consistently display less ST segment elevation than men. The ST segment elevations are less pronounced in the lateral chest leads, and rarely exceed 1 mm in leads V5–V6.
- The ST segment has a concave appearance.
- The T-wave apex is substantially higher than the J point.
- The greater the QRS amplitude, the greater the ST segment elevation.
- Male/female pattern may also appear in the limb leads (particularly II, aVF and III). However, it is much less pronounced in the limb leads (typically <1 mm).
In some textbooks, male/female pattern is referred to as “normal ST segment elevation”.
Log in to view image, video, quiz, text
2. Early repolarization
Early repolarization is another frequently misunderstood condition. Early repolarization occurs in 5–10% of all males (US data). It is somewhat less common among women (prevalence 2–4%). The condition has been recognized for decades, and it has been regarded as a benign form of ST segment elevation. The term “early repolarization” was used to describe what appeared to be premature repolarization on the ECG. As seen in Figure 5, the ST segment elevations are indeed associated with what appears to be an interruption in the QRS complex and initiation of repolarization. However, no study to date has been able to demonstrate that the repolarization is actually early and, moreover, this condition is associated with 5 times as great a risk of sudden cardiac death. The prefix “benign” must therefore not be used. The risk of sudden cardiac death is greatest if the early repolarization pattern occurs in the inferior limb leads (II, aVF and III).
ECG characteristics of early repolarization
- The ST segment elevations are concave and most pronounced in the chest leads. T-waves have high amplitude.
- The hallmark of early repolarization is the end-QRS slurring or end-QRS notching (both may occur on the same ECG). The entire notch must be above the baseline. The slur must start before the baseline is reached. Refer to Figure 5, panel A.
- The end-QRS slur and end-QRS notch are described with the terms Jonset, Jpeak, Jtermination (Figure 5, panel A). In case of chest pain, the level of ST segment elevation is measured in Jtermination.
A recent consensus report on early repolarization (MacFarlane et al, 2016, JACC) stated the following criteria for early repolarization:
- Notch or slur in the transition between R-wave and ST segment. ST segment elevation is almost always present.
- Jpeak is ≥1 mm in at least two anatomically contiguous leads (V1–V3 do not count).
- QRS duration <120 ms.

3. Left ventricular hypertrophy (LVH)
The hallmark of left ventricular hypertrophy (LVH) is the large QRS amplitudes; large R-waves are seen in V5–V6 and deep S-waves in V1–V2. Secondary ST-T changes are frequently seen in V1–V2 (ST segment elevations) and V5–V6 (ST segment depression). Refer to Figure 6 for ECG example.
The ECG in left ventricular hypertrophy
- Large R-waves in V5–V6 and deep S-waves in V1–V2.
- Concave ST segment elevations in V1–V3. The deeper the S-wave, the greater the ST segment elevation.
- Secondary ST segment depressions are seen in V5–V6.
Log in to view image, video, quiz, text
4. Left bundle branch block (LBBB)
Interpretation of ischemia is notoriously difficult in presence of left bundle branch block (LBBB). This is because the left bundle branch block causes marked alterations of left ventricular de- and repolarization. Left bundle branch block always causes prominent secondary ST-T changes which may both imitate and mask ischemia. Several studies have shown that the majority of patients inappropriately referred to the catheterization laboratory (for PCI) with suspicion of STE-ACS/STEMI have left bundle branch block. Hence, left bundle branch block poses a diagnostic challenge.
Early studies, dating back to the 1990s, demonstrated that patients with chest discomfort and new left bundle branch block who were referred immediately to PCI had better survival than comparable patients who were not immediately referred to PCI. A significant proportion of these patients had a total occlusion which could be treated with PCI. Ever since these studies, guidelines recommend that patients with chest discomfort and newly diagnosed left bundle branch block should be referred immediately to the catheterization laboratory with the purpose of performing PCI. However, this will result in referral of many patients without the need of PCI (absence of total occlusion in coronary artery), and the reasons are as follows:
- A significant proportion of the left bundle branch blocks are not new, but simply new to the health care system (e.g lack of previous ECG recordings).
- Even if the left bundle branch block is new, the occlusion may not be total, in which case PCI does not confer any survival benefit.
These topics will be discussed in detail in the chapter Left Bundle Branch Block (LBBB) in Acute Myocardial Infarction and Ischemia. For the purpose of this discussion, the focus will now be redirected to the secondary ST-T changes caused by left bundle branch block.
ECG in left bundle branch block
- Left bundle branch block frequently causes ST segment elevations in leads V1–V2. The ST segment elevation typically has a concave ST segment.
- ST segment depressions are seen in leads V5, V6, aVL and I.
- The hallmark of left bundle branch block is the wide QRS complex (QRS duration ≥0.12 s), deep S-wave in V1–V2, large and clumsy R-wave in V5, V6, aVL and I.
These ECG changes are shown in Figure 7, which should be studied carefully.
Log in to view image, video, quiz, text
5. Acute perimyocarditis (myocarditis)
Myocarditis and pericarditis tend to accompany each other, which is why the term perimyocarditis may be used. This condition may cause severe retrosternal chest pain, very similar to that observed in acute myocardial infarction. It also causes ST segment elevations, but these are typically easy to differentiate from ST segment elevation myocardial infarction (STEMI/STE-ACS). The ST segment elevations in perimyocarditis are generalized, which means that they occur in the majority of the ECG leads. This is highly unusual in STEMI/STE-ACS, in which the ST elevations are confined to the ischemic myocardial area (which in turn depends on the site of the artery occlusion). In the most classical case of perimyocarditits, there are ST segment elevations in all leads except lead V1. The morphology of the ST segment elevations reminds of early repolarization, and there may even be a notch in the J-point. However, the ST segment elevations in perimyocarditis rarely exceed 4 mm (which they certainly may exceed in STEMI/STE-ACS). Moreover, there are no reciprocal ST segment depressions in myocarditis and there are never concomitant T-wave inversions. In STEMI/STE-ACS, on the other hand, reciprocal ST segment depressions are typical and there may be T-wave inversions in the same leads showing ST segment elevation.
T-wave inversion may, however, occur in perimyocarditis, but only after normalization of the ST segment elevations (i.e these two ECG changes do not occur simultaneously).
Finally, the PR segment is frequently depressed in perimyocarditis. This may appear as a downsloping PR segment (in most leads). The only exception is lead V1, which tends to display a PR segment elevation.
An example of perimyocarditis is provided in Figure 8.
Log in to view image, video, quiz, text
6. Hyperkalemia
- Hyperkalemia may cause ST segment elevations in leads V1–V2. The ST segment is typically straight. Pronounced hyperkalemia may cause ST segment elevations similar to those seen in Brugada syndrome.
- Other signs of hyperkalemia are also present (wide QRS complexes, high tented T-waves, diminished P-wave amplitude.
Correction of serum potassium levels will normalize the ECG changes.

7. Brugada syndrome
Brugada syndrome is a rare channelopathy (i.e. an electrical disorder caused by abnormal or absence of ion channel function) that predisposes the individual to syncope, malignant ventricular arrhythmias (ventricular tachycardia, ventricular fibrillation) and sudden cardiac death. There are three types of ECG presentations, referred to as type 1, type 2 and type 3 Brugada syndrome. Refer to Figure 10 for ECG examples of type 1, 2 and 3 Brugada syndrome.
The most typical (and diagnostic) is type 1 Brugada syndrome. It reminds somewhat of right bundle branch block (RBBB) in leads V1–V3, but the QRS duration is not prolonged in leads V5–V6 (this is not consistent with right bundle branch block, in which there must be wide QRS complexes). The ST segment elevation has a coved shape (often described as “shark tail”) in V1, V2 or V3. The ST segment starts at the apex of the second R-wave and is downsloping (panel A, Figure 10). The T-wave is negative (inverted).
In type 2 and type 3 Brugada syndrome, the ST segment elevation is saddleback shaped (panels B and C, Figure 10). The difference between type 2 and type 3 is that the ST segment elevation in type 2 is elevated ≥2 millimeters (it is lower in type 3 Brugada syndrome).
For details, please refer to Brugada syndrome.

8. Arrhythmogenic right ventricular cardiomyopathy/dysplasia (ARVC/D)
Arrhythmogenic right ventricular cardiomyopathy / dysplasia (ARVC / ARVD) may cause ST segment elevations in V1–V3 similar to those seen in Brugada syndrome.
9. Pre-excitation & WPW (Wolff-Parkinson-White syndrome)
Pre-excitation (i.e premature activation) of ventricular myocardium due to an accessory pathway between atria and ventricle results in abnormal depolarization of the ventricles, which leads to abnormal repolarization. The secondary ST-T changes manifest as ST elevations and ST depressions. Pre-excitation may also cause abnormal Q-waves. Refer to Figure 11 for ECG example. Refer to Pre-excitation & WPW (Wolff-Parkinson-White syndrome) for details on pre-excitation syndromes.
Log in to view image, video, quiz, text
10. Electrical cardioversion
Transient (usually minutes) ST segment elevations may follow electrical cardioversion. The ST segment elevations are similar to those seen in Brugada syndrome. Refer to Figure 12 for ECG example.

11. Takotsubo cardiomyopathy (broken-heart syndrome, apical ballooning syndrome, stress-induced cardiomyopathy)
Takotsubo cardiomyopathy is a rather peculiar and acute condition. Much research has been devoted to this condition in recent years. Virtually all cases of takotsubo cardiomyopathy occur in situations with extreme stress, such as car accidents, gun violence, other threats, or any other situation in which the individual’s life is (or perceived as it is) at danger. Takotsubo cardiomyopathy is much more common in women. The typical patient presents with severe chest pain, dyspnea and in some cases hemodynamic compromise. The ECG shows localized ST segment elevations, T-wave inversions and occasionally pathological Q-waves. Troponin levels are frequently elevated. Hence, takotsubo cardiomyopathy cannot be differentiated from ST segment elevation myocardial infarction (other than the anamnesis). These patients are referred to immediate catheterization, in which no coronary occlusions can be found, but injection of contrast media reveals that the apical portion of the left ventricle is dilated (hence the term apical ballooning syndrome). This syndrome was first described in 1991 in Japan, and the authors termed it takotsubo, which is the Japanese word for a kind of octopus trap (the left ventricle takes the shape of that octopus trap).
Studies from the US and Japan have estimated that up to 2% of patients referred to PCI with suspicion of STE-ACS/STEMI, actually have takotsubo. Previous studies reported that 98 out of 100 cases had a full recovery. More recent studies (Omerovic et al) have reported mortality rates reaching 4%.
- 80% of patients have localized ST segment elevations (mostly in the chest leads). The morphology of the ST segment elevations cannot be differentiated from those seen in STEMI/STE-ACS.
- 64 % have T-wave changes (mostly inversions) accompanying the ST segment elevations.
- 32% have pathological Q-waves.
Refer to Takotsubo cardiomyopathy (apical ballooning, stress-induced cardiomyopathy) for details.
12. Prinzmetal’s angina (variant angina, coronary artery vasospasm)
Prinzmetal’s angina is caused by coronary artery vasospasm. The vasospasm causes total occlusion of the coronary artery, which results in ST segment elevations. However, the vasospasm and thus the ischemia is virtually always transient and resolves before the development of infarction. The ST segment elevations are followed by T-wave inversions which may persist for days or even weeks.
13. Pulmonary embolism
Pulmonary embolism may cause ST segment elevations in V1, V2, II, aVF and III. However, the most common ECG finding in pulmonary embolism is sinus tachycardia. Occasionally the S1Q3T3 pattern may be seen; this means that there is a prominent S-wave in lead I, large Q-wave in lead III and T-wave inversion in lead III. Moreover, T-wave inversions in lead V1–V3 are common in pulmonary embolism. Finally, a new right bundle branch block (RBBB) should always raise suspicion of pulmonary embolism in patients with dyspnea.
Log in to view image, video, quiz, text
14. Hypothermia & hypercalcemia
Both these conditions may engender J-waves (in any leads). J-waves are also called Osborn’s waves, particularly in the context of hypothermia and hypercalcemia. However, there are two other J-wave syndromes, namely Brugada syndrome and early repolarization.

J-waves (Osborn’s waves) and J-wave syndromes are discussed separately.
15. Proximal aortic dissection
Aortic dissection may engage the aortic bulb (bulbus aortae) and thus occlude the coronary artery ostia (most frequently the right coronary artery ostium). The ensuing occlusion causes ST segment elevations and transmural ischemia. The prognosis of this condition is extremely poor.
16. Left ventricular aneurysm
Left ventricular aneurysm is a complication of transmural infarctions (STEMI) and may cause persistent ST-segment elevations. These may persist for months or even years. The ST segment elevations occur in the ECG leads reflecting the aneurysmatic area.

