T-waves in ischemia: hyperacute, inverted (negative), Wellen’s sign & de Winter’s sign
T-wave changes in acute myocardial infarction & ischemia
- The normal T-wave
- The inverted (negative) T-wave
- Ischemic T-wave inversions
- Biphasic (diphasic) T-waves
- Wellen’s syndrome (Wellen’s sign, LAD-T-Wave Inversion Pattern)
- Non-ischemic T-wave inversion (negative T-waves due to other causes)
- Hyperacute T-waves
- de Winter’s sign (persistent hyperacute T-wave syndrome)
- Pseudonormalized T-waves
A thorough discussion regarding the physiology of the T-wave was previously provided. Only aspects relevant to ischemia will be discussed here. The T-wave is notoriously difficult to judge, which is why a rather comprehensive discussion is warranted. The normal T-wave will be described first. Then, ischemic T-wave changes – i.e hyperacute T-waves, inverted T-waves, flat T-waves, Wellen’s syndrome and de Winter’s syndrome – will be discussed in detail.
The normal T-wave
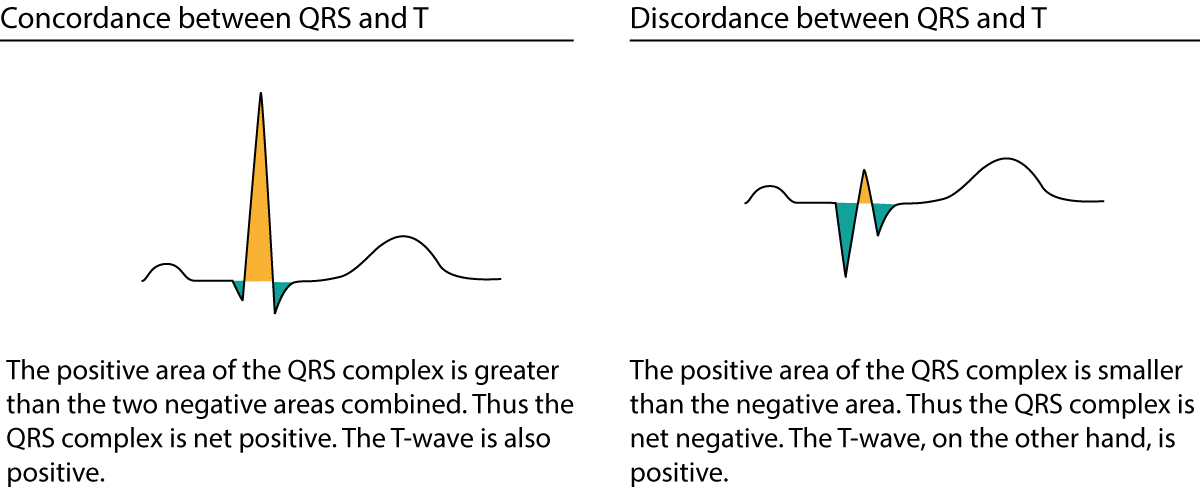
The normal T-wave is concordant with the QRS complex, meaning that it has the same direction as the net direction of the QRS complex. A net positive QRS complex should be followed by a net positive T-wave (refer to the previous discussion on concordance/discordance and Figure 1). If the T-wave and the QRS complex head in opposite directions, the T-wave is said to be discordant which is abnormal. Because most ECG leads have net positive QRS complexes (during normal circumstances) the T-wave is typically positive in all leads. It is, however, common to have a negative T-wave in lead V1, which also has a net negative QRS complex (i.e the negative T-wave is actually concordant with the QRS, which makes this a normal finding).
The transition from ST segment to T-wave should be smooth. The amplitude of the T-wave is rarely >6 mm in the limb leads. In the chest leads the amplitude is highest in V2–V3; males may display up to 10 mm T-wave amplitude in these leads, although most have <6 mm in V2–V3. T-wave amplitude is on average 3 mm in V2–V3 in females and it rarely exceeds 8 mm. Note that the amplitude of the T-wave is related to the amplitude of the QRS complex (large QRS amplitudes yield large T-wave amplitudes, and vice versa). Last but not least, the normal T-wave is slightly asymmetric; the slope of the descending limb is slightly steeper than the ascending limb.
A rather detailed reference regarding the direction of T-waves follows:
- I, II, -aVR, V5 and V6 should display positive T-waves in adults.
- aVR displays a negative T-wave in adults.
- III and aVL may occasionally display an isolated (single) T-wave inversion. The term isolated implies that none of the neighboring leads display T-wave inversions.
- aVF generally shows a positive T-wave but it may occasionally be flat.
- V1 may show an inverted or flat T-wave (particularly common in women). The inversion is concordant with the QRS complex, which is also negative in V1.
- V7–V9 should display a positive T-wave.
T-wave abnormalities are common and occur in a wide range of conditions. Unfortunately, many clinicians tend to misinterpret the T-wave and some find it difficult to put T-wave changes into clinical context. Therefore, we will now discuss each T-wave abnormality and clarify common misunderstandings.
The inverted (negative) T-wave
T-wave inversion means that the T-wave is negative. By definition, the T-wave is negative if the terminal portion of the T-wave is below the baseline. T-wave inversions are actually graded according to the amplitude (depth). Strictly speaking the term T-wave inversion refers to T-waves that are 1 to 5 mm negative (deep). The term deep T-wave inversion is applied to T-waves 5 to 10 mm deep. The term gigantic T-wave inversion is used if the T-wave is deeper than 10 mm. Myocardial ischemia may present with any degree of T-wave inversion. Myocardial ischemia may also present with flat T-waves, which are defined as T-waves with an amplitude between +1 and -1 mm.
Ischemic T-wave inversions
It is a widespread misunderstanding that isolated T-wave inversions indicate acute (ongoing) ischemia. Isolated T-wave inversions – i.e T-wave inversions without concomitant ST segment deviation (elevation or depressions) – is never a sign of acute ischemia. T-wave inversions with concomitant ST segment deviations are, however, typical of ischemia but in that scenario, it is actually the ST segment deviation that reflects the ischemia. The reason why guidelines include isolated T-wave inversions as valid criteria for myocardial infarction is simply that isolated T-wave inversions occur after the ischemia has resolved (i.e they confirm that ischemia has occurred, but it is not ongoing). Isolated T-wave inversions in persons presenting with symptoms of myocardial ischemia are referred to as post-ischemic T-wave inversions. To clarify, isolated T-wave inversions indicate that there has been ischemia.
Ischemic T-wave inversions are symmetric (the normal T-wave is asymmetric) and maybe, but rarely are, deeper than 10 mm. ECG leads with the opposite angles of observation (opposite to leads with T-wave inversions) usually display positive T-waves. Post-ischemic T-waves may be accompanied by negative U-waves, which further increases the likelihood of ischemia as the underlying cause.
The T-wave inversions following myocardial infarction usually resolve within days or weeks, but they may become chronic (defined as persisting >1 year). Normalization of T-wave inversion after infarction indicates some recovery in the infarct area.
Figure 2 must be studied carefully. It presents the characteristics and significance of all clinically relevant T-wave inversions.
Log in to view image, video, quiz, text

ECG criteria for acute myocardial infarction:
T wave inversion ≥1 mm in at least two anatomically contiguous leads. These leads must have evident R-waves, or R-waves larger than S-waves.
Evidence as to why isolated T-wave inversions do not indicate acute ischemia
The following observations indicate why isolated T-wave inversions cannot be a sign of acute (ongoing) ischemia.
- Patients with stable coronary artery disease (angina pectoris) never display new isolated T-wave inversions during exercise stress testing.
- When ECG is recorded during ongoing chest pain (angina pectoris), T-wave inversions never occur without concomitant ST-segment deviation (depression/elevation).
- Patients with myocardial infarction and isolated T-wave inversions have a prognosis similar to patients with completely normal ECG.
- Inverted T-waves develop between 12 and 24 hours after symptom onset in STEMI/STE-ACS. These T-waves succeed the ST-segment elevations and thus indicate that there is no longer any ongoing ischemia.
- T-wave inversions with rapid normalization during PCI (percutaneous coronary intervention) indicate reperfusion of the artery.
Biphasic (diphasic) T-waves
A biphasic T-wave has a positive and a negative deflection. It should be noted that the term “biphasic” is unfortunate because (i) biphasic T-waves carry no particular significance and (ii) a T-wave is classified as positive or inverted based on its terminal portion; if the terminal portion is positive then the T-wave is positive and vice versa.
Wellen’s syndrome (Wellen’s sign, LAD-T-Wave Inversion Pattern)
As evident from the discussion above, isolated T-wave inversions are not acute and perhaps not even more alarming than a normal ECG (among patients with chest discomfort). There is one notable exception to this rule, namely Wellen’s syndrome. Patients with Wellen’s syndrome have recently (within 24–48 hours) had pronounced angina pectoris, but may experience no symptoms during the presentation. They display deep and symmetric T-wave inversions in leads V1–V6, aVL and I (at least in leads V2–V5). There is no significant ST segment deviation (elevation or depression) and troponins are usually below the upper reference limit (or just slightly elevated). This syndrome is caused by severe and proximal stenosis in LAD (left anterior descending coronary artery). These patients typically have rich collateral coronary circulation. A representative ECG is presented in Figure 3. Note that in some cases of Wellen’s syndrome the initial part of the ST segment may be slightly upsloping.
Log in to view image, video, quiz, text
Approximately 10% of patients with acute coronary syndromes have Wellen’s syndrome; 75% of these will develop massive anterior myocardial infarction with a high risk of developing heart failure unless revascularization is carried out expeditiously. Wellen’s syndrome is therefore a case of isolated T-wave inversion which is very acute. Angiography should be carried out immediately to minimize the risk of developing massive infarction. The risk is particularly high in patients presenting with T-wave inversions in leads I and aVL, since virtually all those patients have very severe and proximal LAD stenosis.
Non-ischemic T-wave inversion (negative T-waves due to other causes)
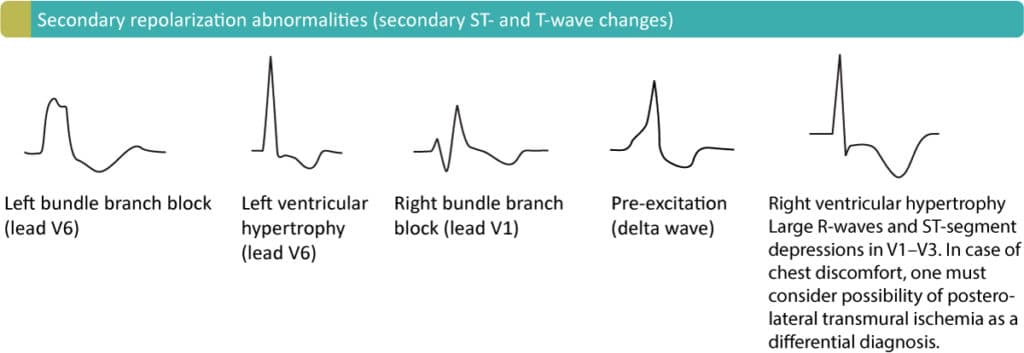
Secondary T-wave inversions may be caused by left bundle branch block, right bundle branch block, pre-excitation, left ventricular hypertrophy, right ventricular hypertrophy, and pacemaker rhythm (if the pacemaker stimulates in the ventricular myocardium). These are all common conditions in which the depolarization of the ventricles is abnormal, and this leads to abnormal repolarization (ST-T segment). ST-T changes seen in these conditions are referred to as secondary ST-T changes, and they include ST-segment deviation (elevation/depression) and T-wave inversion. Note that the T-wave inversion may persist for some time after normalization of the depolarization (if that occurs at all). This is a phenomenon called T-wave memory, and it is often seen among patients with pacemakers (T-waves continue to be inverted even when the beats are not paced. Figure 4 displays these secondary T-wave inversions.
Cerebrovascular insult pattern implies the presence of deep or gigantic symmetric T-wave inversions in leads V1–V6, and occasionally the limb leads. This occurs in patients with stroke (in most cases intracerebral hemorrhage). Prolonged QT interval and evident T-waves may also occur. According to Surawicz and Schindler, up to 30% of patients with hemorrhage may display this ECG pattern, which is shown in Figure 2, panel D.
Hypertrophic cardiomyopathy may cause deep isolated T-wave inversions in leads V2–V5. These T-wave inversions are accompanied by increased R- and S-wave amplitudes. Refer to Figure 2, panel D.
Hyperacute T-waves
Large T-waves occur in several conditions such as hyperkalemia, early repolarization and male/female pattern. However, ischemia may cause very large symmetric T-waves with a broad base (contrary to hyperkalemia which causes large T-waves with a narrow base). Such hyperacute T-waves (Figure 2, panel B) occur within seconds after total occlusion of a coronary artery and usually resolve within minutes (they are succeeded by ST-segment elevations). Hence, hyperacute T-waves are the first ECG change in STE-ACS/STEMI. Since they are short-lived it is uncommon to encounter them in clinical practice. Recall that T-waves should not exceed 10 mm in chest leads and 5 mm in limb leads.
de Winter’s sign (persistent hyperacute T-wave syndrome)
As mentioned above hyperacute T-waves have a short duration. There is one alarming exception, namely de Winter’s sign, in which hyperacute T-waves persist for hours and are accompanied by ST-segment depressions with upsloping ST-segments. This syndrome, which is a sign of proximal LAD occlusion, was reported in 2008. The ST-segment depressions are 1–3 mm deep in V1–V6, with an upsloping ST-segment that continues in hyperacute T-waves. This pattern has been reported to occur in 2% of patients undergoing acute PCI towards LAD. Refer to Figure 5.
Log in to view image, video, quiz, text
Pseudonormalized T-waves
If patients with previously known T-wave inversions (verified on previous ECG recordings) display normalization of these inversions during chest pain, one must suspect myocardial ischemia. This phenomenon, in which inverted T-waves become normalized, is referred to as pseudonormalization and it strongly suggests ischemia. Importantly, this rule applies regardless of the cause of the T-wave inversions (left bundle branch block, left ventricular hypertrophy, pre-excitation, right bundle branch block, right ventricular hypertrophy, pacemaker etc). In the case of left bundle branch block, pseudonormalization (occurs in V5, V6, aVL and I) is almost diagnostic for myocardial ischemia. Similarly, patients who have developed T-wave inversions after ischemia/infarction may actually develop pseudonormalization of these in case of re-ischemia/re-infarction.

