Cardiac electrophysiology: Action potential, automaticity and vectors
Cardiac electrophysiology: Membrane potential, action potential, automaticity and electrical vectors
Video lecture
The following video lecture summarises this chapter.

The action potential includes a depolarization (activation) followed by a repolarization (recovery). The action potential occurs in all cardiac cells but its appearance varies depending on cell type. During de- and repolarization ions (Na+ [sodium], K+ [potassium] and Ca2+ [calcium]) flow back and forth across the cell membrane. Because ions are electrically charged, their movement generates an electrical current. This means that the propagation (spread) of the action potential is equal to the spread of an electrical current.
All tissues and fluids surrounding the heart have an abundance of ions, enabling them to function as electrical conductors. As a result, the electrical currents produced by the myocardium are transmitted through the body to the skin, where they can be detected using electrodes. The electrocardiograph (ECG machine) records and processes these electrical currents and presents them as the electrocardiogram (ECG). As mentioned earlier, the electrical potentials of the conduction system are much too small to be detected by skin electrodes; the ECG presents the electrical activity of the atrial and ventricular myocardium.
Automaticity of pacemaker cells
The automaticity of the cells in the sinoatrial node is explained by the fact that these cells start leaking sodium (Na+) into the cell as soon as they return to their resting state (Figure 1). As sodium leaks into the cell, the membrane becomes more positive. When the membrane potential reaches its threshold –40 mV, the action potential is triggered and the cell depolarizes. At –40 mV voltage-gated calcium (Ca2+) channels open so that calcium flows into the cell and causes depolarization. Subsequently, outward-directed potassium (K+) channels open which results in cell repolarization. The cycle then repeats itself (Figure 1). Note that the leakage of sodium during the resting phase is called pacemaker potential.

The depolarization spreads from the sinoatrial node to the atrial and ventricular myocardium. Propagation of the action potential is possible because all cardiac cells are electrically interconnected by gap junctions (Figure 1). Gap junctions are protein channels that connect the cell membranes of adjacent cells and enable the flow of ions between cells. This means that the action potential spreads from one cell to another via gap junctions. The density of gap junctions within the Purkinje network is very high, which explains the rapid impulse transmission in the network. Cells of the atrioventricular node, on the contrary, have a low density of gap junctions, explaining the slow impulse conduction through the atrioventricular node. Transmission of the action potential between contractile myocardial cells is also slow, owing to the scarcity of gap junctions between them.
The action potential in contractile cells
The contractile cells, unlike cells of the sinoatrial node, display a true resting potential (phase 4), which is around –90 mV. These cells must be stimulated in order to evoke an action potential. Upon stimulation, sodium (Na+) channels open which causes a rapid influx of sodium and depolarizes the cell. Contractile cells start to contract a few milliseconds after the start of the depolarization and they start relaxing a few milliseconds after the repolarization is completed. The duration of the action potential is approximately 0.20 seconds in atrial myocardium and 0.3 seconds in the ventricular myocardium (Figure 1).
The phases are also illustrated in Figure 1 (above).
- Phase 4 (resting phase): Only potassium (K+) channels are open during the resting phase and efflux (outward flow) of potassium establishes a negative resting membrane potential (approximately –90 mV).
- Phase 0 (depolarization): Upon stimulation, rapid depolarization occurs via influx (inward flow) of sodium (Na+) and the cell becomes positively charged (approximately 20 mV).
- Phase 1 (early repolarization): During this phase, another type of potassium (K+) channels opens and a brief efflux of potassium repolarizes the cell slightly.
- Phase 2 (plateau phase): Almost simultaneous with the opening of potassium channels in phase 1, persistent calcium (Ca2+) channels open whereby calcium flows into the cell. The influx of calcium is steady and gives rise to the plateau phase whose long duration explains why the vast majority of the ventricular myocardium contracts simultaneously (at some point during the contraction).
- Phase 3 (repolarization): Calcium (Ca2+) channels close and potassium (K+) channels open again and the efflux of potassium repolarizes the cell.
Absolute and relative refractory periods during the action potential
During the greater part of the action potential, the myocardial cell is absolutely refractory to stimulation, meaning that an additional stimulus cannot trigger a new action potential, regardless of the intensity of the stimulus. The absolute refractory period is followed by a relative refractory period, during which a strong stimulation may trigger a new action potential. The absolute and relative refractory periods are displayed in Figure 1 (above) and Figure 2 (below).

As seen in Figure 2, the relative refractory period coincides with the T-wave apex. This phase has traditionally been described as a vulnerable phase during the cardiac cycle, because electrical stimulation during this phase may evoke another action potential which can lead to potentially life-threatening ventricular arrhythmias (ventricular fibrillation). This occurs occasionally in clinical practice. The stimulus is typically a premature ventricular beat (i.e. an ectopic beat from within the ventricles) or inappropriate stimulation from an artificial pacemaker. When such a ventricular depolarization is superimposed on the T-wave, it is said that an R-on-T phenomenon has occurred. However, it should be noted that R-on-T phenomena are very common and the risk of ventricular fibrillation is small unless there is electrical instability in the ventricles (such as during acute myocardial infarction, long QT syndrome, etc.). Figure 3 (below) shows two cases of R-on-T phenomenon.
Log in to view image, video, quiz, text

What does the ECG show?
Figure 4 shows the classical ECG waveforms. The first deflection (henceforth called wave) is the P-wave, which represents atrial activation (depolarization). The repolarization of the atria is usually not visible because it occurs simultaneously with ventricular activation (depolarization), which generates substantially larger electrical potentials and therefore dominates that moment in the cardiac cycle. Ventricular depolarization is visible as the QRS complex. The QRS complex consists of three waves: Q, R and S. Differences in the direction of these waves are due to changes in the direction of the electrical impulse during ventricular depolarization. The T-wave represents the repolarization of the ventricles.

Note the straight line between the P-wave and the QRS complex (Figure 4). This line is referred to as the PR segment and it represents the impulse delay in the atrioventricular node.
It is fundamental to know the genesis of these waveforms and this requires knowledge of the electrical vectors that exist during the cardiac cycle. Vector theory is a rather complex matter, which is why the discussion below will exclude overly complicated aspects and focus on the main electrical vectors and how they impact the ECG curve.
Electrical vectors
A vector is a physical quantity that has both magnitude and direction in space. The movement of electrically charged particles – which occurs during the spread of the cardiac action potential – generates an electrical vector. The depolarization propagates through the myocardium similar to the spread of a wavefront in water. At any given instant in time there are numerous small depolarizing wave fronts that propagate through the myocardium (Figure 5, left-hand side). The average of all individual wavefronts, at any given instant in time, represents the main electrical vector (Figure 5, right-hand side). Thus the electrical vector is the average direction of the impulse. The ECG waveforms displayed in Figure 5 actually represent the electrical vectors of the cardiac cycle.
Log in to view image, video, quiz, text
In order to understand how an electrical vector generates a wave on the ECG curve, it is crucial to understand how ECG leads are constructed. Note that the ECG leads will be discussed in detail in the next chapter; here, we only mention aspects relevant to electrical vectors. The electrocardiograph (ECG machine) uses two electrodes to calculate one ECG curve (Figure 6). This is done by comparing the electrical potentials detected by each of the electrodes. One electrode is defined as positive (also called exploring electrode) and the other is negative (also called reference electrode). The electrocardiograph compares the electrical potentials detected by the exploring electrode and the reference electrode. The machine is constructed such that a vector heading toward the exploring electrode yields a positive deflection (wave) on the ECG curve. A vector heading away from the exploring electrode yields a negative wave (Figure 6).
It is traditionally taught that the exploring electrode is the one “viewing” the heart, and this notion facilitates ECG interpretation. The physiological rationale behind this is explained below.

Now that the relation between electrical vectors and ECG waves has been clarified, it is time to study the main vectors of the heart and how they give rise to the classical ECG curve. Leads V1 and V5 have been selected for pedagogical reasons. V1 and V5 primarily detect vectors traveling in the horizontal plane. This is due to the placement of the exploring electrode and the reference. The exploring electrode is placed anteriorly on the chest wall. The reference is slightly more complicated because it is derived by taking the average of the potentials recorded by the limb electrodes (right arm, left arm, left leg) and this yields a reference located in the chest (Figure 7). This will be discussed in greater detail in the next chapter, but for the current discussion, it is sufficient to note that the exploring electrode is located anteriorly on the chest and the reference point is located inside the chest (Figure 7). We shall now examine the main electrical vectors of the heart and how they are reflected in V1 and V5. Study this figure carefully, as it explains the genesis and appearance of the P, Q, R and S waves on the ECG curve.
Log in to view image, video, quiz, text
The first vector: the atria
The first vector originates from atrial depolarization. The depolarization starts in the sinoatrial node, from where it spreads through the right atrium and subsequently to the left atrium. During activation of the right atrium, the vector is directed anteriorly and to the left (and downwards). The vector turns left and somewhat backward as the depolarization heads toward the left atrium. Thus, the atrial vector is slightly curved (Figure 7). Lead V1 detects the initial vector heading towards it and displays a positive deflection, the P-wave. V1 may also detect that the vector heads away from it when the left atrium is activated and this might yield a small negative deflection on the terminal portion of the P-wave (Figure 7). Lead V5 on the other hand, only notes vectors heading towards it (albeit with varying angles) throughout the course of atrial activation and therefore displays a uniformly positive P-wave.
The second vector: the ventricular (interventricular) septum
The ventricular septum receives Purkinje fibers from the left bundle branch and therefore depolarization proceeds from its left side towards its right side. The vector is directed forward and to the right. The ventricular septum is relatively small, which is why V1 displays a small positive wave (r-wave) and V5 displays a small negative wave (q-wave). Thus, it is the same electrical vector that results in an r-wave in V1 and a q-wave in V5.
The third vector: the ventricular free wall
The vectors resulting from the activation of the ventricular free walls are directed to the left and downwards (Figure 7). The explanation for this is as follows:
- The vector resulting from activation of the right ventricle does not come to expression, because it is drowned by the many times larger vector generated by the left ventricle. Thus, the vector during activation of the ventricular free walls is actually the vector generated by the left ventricle.
- Activation of the ventricular free wall proceeds from the endocardium to the epicardium. This is because the Purkinje fibers run through the endocardium, where they deliver the action potential to contractile cells. The subsequent spread of the action potential occurs from one contractile cell to another, starting in the endocardium and heading toward the epicardium.
As evident from Figure 7, the vector of the ventricular free wall is directed to the left (and downwards). Lead V5 detects a very large vector heading towards it and therefore displays a large R-wave. Lead V1 records the opposite and therefore displays a large negative wave called S-wave.
The fourth vector: basal parts of the ventricles
The final vector stems from the activation of the basal parts of the ventricles. The vector is directed backward and upwards. It heads away from V5 which records a negative wave (s-wave). Lead V1 does not detect this vector.
The vector of the T-wave
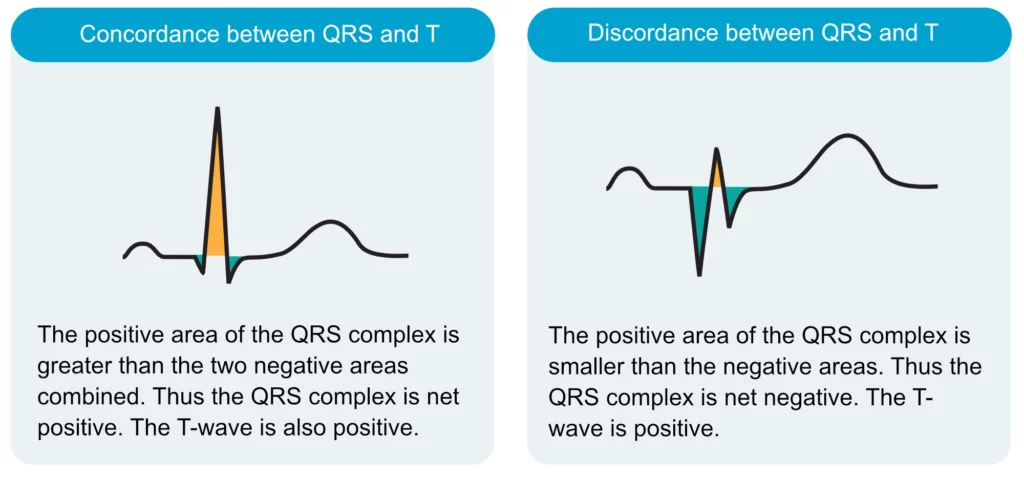
The T-wave represents the rapid repolarization phase (phase 2). The T-wave should be concordant with the QRS complex, meaning that it should have the same direction as the net direction of the QRS complex. A QRS complex that is net negative should be followed by a negative T-wave, whereas a QRS complex that is net positive should be followed by a positive T-wave. If the QRS complex and T-wave have opposite directions, it is said that the T-wave is discordant (Figure 8).
It may seem illogical that the QRS complex and the T-wave should have the same direction, given that the ion flows during de- and repolarization are opposite. It seems more logical that de- and repolarization should have opposite directions. Evidently, this is not the case because not only are the ion flows opposite, but so is the direction of the electrical vector. Recall that depolarization of the ventricular free wall proceeds from endocardium to epicardium. Repolarization, on the other hand, starts in the epicardium and is directed toward the endocardium (Figure 9). This is explained by the fact that epicardial cells have shorter action potentials and therefore begin repolarizing earlier than endocardial cells. Refer to Figure 9 for an illustrated explanation.
To conclude, since both (1) ion flows and (2) the direction of the vector are opposite during repolarization, there is no net effect on the ECG curve and the T-wave will be concordant with the QRS complex.
The T-wave vector is normally directed forward and slightly to the left and downwards. However, children and adolescents may have a T-wave vector directed more to the left and backward, which yields negative T-waves in the right-sided chest leads (V1–V4). These become normalized (i.e. positive) during puberty. Note, however, that a negative T-wave in lead V1 is a common finding and it is concordant with the QRS complex, which is generally negative in V1 (these aspects are discussed later).
Log in to view image, video, quiz, text
Finally, note that the P-wave and T-wave are smooth waves, whereas the QRS complex has sharp spikes. This is due to the fact that P- and T-waves are generated by low-frequency signals, whereas the QRS complex has a much higher frequency.

