Clinical ECG Interpretation
-
Introduction to ECG Interpretation6 Chapters
-
Cardiac electrophysiology and ECG interpretation
-
Cardiac electrophysiology: Action potential, automaticity and vectors
-
The ECG leads: Electrodes, limb leads, chest (precordial) leads and the 12-Lead ECG
-
The Cabrera format of the 12-lead ECG and inverted lead aVR
-
ECG interpretation: Characteristics of the normal ECG (P-wave, QRS complex, ST segment, T-wave)
-
How to interpret the ECG: A systematic approach
-
Cardiac electrophysiology and ECG interpretation
-
Arrhythmias and arrhythmology24 Chapters
-
Mechanisms of cardiac arrhythmias: from automaticity to re-entry (reentry)
-
Aberrant ventricular conduction (aberrancy, aberration)
-
Premature ventricular contractions (premature ventricular complex, premature ventricular beats)
-
Premature atrial contraction (premature atrial beat / complex): ECG and clinical implications
-
Sinus rhythm: physiology, ECG criteria & clinical implications
-
Sinus arrhythmia (respiratory sinus arrhythmia)
-
Sinus bradycardia: definitions, ECG, causes and management
-
Chronotropic incompetence (inability to increase heart rate)
-
Sinoatrial arrest & sinoatrial pause (sinus pause / arrest)
-
Sinoatrial block (SA block): ECG criteria, causes and clinical features
-
Sinus node dysfunction (SND) and sick sinus syndrome (SSS)
-
Sinus tachycardia & Inappropriate sinus tachycardia
-
Atrial fibrillation: ECG, classification, causes, risk factors & management
-
Atrial flutter: classification, causes, ECG criteria and management
-
Ectopic atrial rhythm (EAT), atrial tachycardia (AT) & multifocal atrial tachycardia (MAT)
-
Atrioventricular nodal reentry tachycardia (AVNRT): ECG features & management
-
Pre-excitation, Atrioventricular Reentrant (Reentry) Tachycardia (AVRT), Wolff-Parkinson-White (WPW) syndrome
-
Junctional rhythm (escape rhythm) and junctional tachycardia
-
Ventricular rhythm and accelerated ventricular rhythm (idioventricular rhythm)
-
Ventricular tachycardia (VT): ECG criteria, causes, classification, treatment
-
Long QT (QTc) interval, long QT syndrome (LQTS) & torsades de pointes
-
Ventricular fibrillation, pulseless electrical activity and sudden cardiac arrest
-
Pacemaker-mediated tachycardia (PMT): ECG and management
-
Diagnosis and management of supraventricular and ventricular tachyarrhythmias: Narrow complex tachycardia & wide complex tachycardia
-
Mechanisms of cardiac arrhythmias: from automaticity to re-entry (reentry)
-
Myocardial Ischemia & Infarction24 Chapters
-
Introduction to Coronary Artery Disease (Ischemic Heart Disease)
-
Classification of Acute Coronary Syndromes (ACS) & Acute Myocardial Infarction (AMI)
-
A New Approach to Acute Coronary Syndromes: Occlusion MI (OMI) vs. Non-Occlusion MI (NOMI)
-
Clinical application of ECG in chest pain & acute myocardial infarction
-
Diagnostic Criteria for Acute Myocardial Infarction: Cardiac troponins, ECG & Symptoms
-
Cardiac troponin I (TnI) and T (TnT): Interpretation and evaluation in acute coronary syndromes
-
Myocardial Ischemia & infarction: Cellular changes, ECG and symptoms
-
The left ventricle in myocardial ischemia and infarction
-
Factors that modify the natural course in acute myocardial infarction (AMI)
-
ECG in myocardial ischemia: ischemic changes in the ST segment & T-wave
-
ST segment depression in myocardial ischemia and differential diagnoses
-
ST segment elevation in acute myocardial ischemia and differential diagnoses
-
ST elevation myocardial infarction (STEMI) without ST elevations on 12-lead ECG
-
T-waves in ischemia: hyperacute, inverted (negative), Wellen's sign & de Winter's sign
-
ECG manifestations of left main coronary artery (LMCA) occlusion and critical stenosis
-
ECG signs of myocardial infarction: pathological Q-waves & pathological R-waves
-
Other ECG changes in ischemia and infarction
-
Supraventricular and intraventricular conduction defects in myocardial ischemia and infarction
-
ECG localization of myocardial infarction / ischemia and coronary artery occlusion (culprit)
-
The ECG in assessment of myocardial reperfusion
-
Approach to patients with chest pain: differential diagnoses, management & ECG
-
Stable Coronary Artery Disease (Angina Pectoris): Diagnosis, Evaluation, Management
-
NSTEMI (Non-ST Elevation Myocardial Infarction) & Unstable Angina: Diagnosis, Criteria, ECG, Management
-
STEMI (ST Elevation Myocardial Infarction): Diagnosis, ECG, Criteria, and Management
-
Introduction to Coronary Artery Disease (Ischemic Heart Disease)
-
Conduction Defects11 Chapters
-
Overview of atrioventricular (AV) blocks
-
First-degree AV block (AV block I, AV block 1)
-
Second-degree AV block: Mobitz type 1 (Wenckebach) & Mobitz type 2 block
-
Third-degree AV block (3rd degree AV block, AV block 3, AV block III)
-
Management and treatment of AV block (atrioventricular blocks)
-
Intraventricular conduction delay: bundle branch blocks & fascicular blocks
-
Right bundle branch block (RBBB): ECG, criteria, definitions, causes & treatment
-
Left bundle branch block (LBBB): ECG criteria, causes, management
-
Left bundle branch block (LBBB) in acute myocardial infarction: the Sgarbossa criteria
-
Fascicular block (hemiblock): Left anterior & left posterior fascicular block
-
Nonspecific intraventricular conduction delay (defect)
-
Overview of atrioventricular (AV) blocks
-
Cardiac Hypertrophy & Enlargement5 Chapters
-
Atrial and ventricular enlargement: hypertrophy and dilatation on ECG
-
ECG in left ventricular hypertrophy (LVH): criteria and implications
-
Right ventricular hypertrophy (RVH): ECG criteria & clinical characteristics
-
Biventricular hypertrophy ECG and clinical characteristics
-
Left atrial enlargement (P mitrale) & right atrial enlargement (P pulmonale) on ECG
-
Atrial and ventricular enlargement: hypertrophy and dilatation on ECG
-
Drugs & Electrolyte Imbalance3 Chapters
-
Genetics, Syndromes & Miscellaneous7 Chapters
-
ECG J wave syndromes: hypothermia, early repolarization, hypercalcemia & Brugada syndrome
-
Brugada syndrome: ECG, clinical features and management
-
Early repolarization pattern on ECG (early repolarization syndrome)
-
Takotsubo cardiomyopathy (broken heart syndrome, stress induced cardiomyopathy)
-
Pericarditis, myocarditis & perimyocarditis: ECG, criteria & treatment
-
Eletrical alternans: the ECG in pericardial effusion & cardiac tamponade
-
Long QT Syndrome (LQTS)
-
ECG J wave syndromes: hypothermia, early repolarization, hypercalcemia & Brugada syndrome
-
Exercise Stress Testing (Exercise ECG)6 Chapters
-
Introduction to exercise stress testing (treadmill test, exercise ECG)
-
Indications, Contraindications, and Preparations for Exercise Stress Testing
-
Exercise stress test (exercise ECG): protocols, evaluation & termination
-
Exercise stress testing in special patient populations
-
Exercise physiology: from normal response to myocardial ischemia & chest pain
-
Evaluation of exercise stress test: ECG, symptoms, blood pressure, heart rate, performance
-
Introduction to exercise stress testing (treadmill test, exercise ECG)
ECG signs of myocardial infarction: pathological Q-waves & pathological R-waves
Pathological Q-waves are evidence of myocardial infarction
Myocardial infarction – particularly if extensive in size – typically manifests with pathological Q-waves. These Q-waves are wider and deeper than normally occurring Q-waves, and they are referred to as pathological Q-waves. They typically emerge between 6 and 16 hours after symptom onset, but may occasionally develop earlier. Standard textbooks have traditionally taught that the pathological Q-wave is a permanent ECG manifestation and that it represents transmural infarction (STEMI). However, recent studies challenge these notions. Pathological Q-waves may resolve in up to 30% of patients with inferior infarction. The amplitude of Q-waves may also diminish over time. Moreover, magnetic resonance imaging has suggested that pathological Q-waves may also arise due to extensive subendocardial infarction (NSTEMI).
If pathological Q-waves occur as a result of myocardial infarction, the infarction may be classified as Q-wave infarction (this has negligible clinical implication). Hence, Q-wave infarctions are mostly the result of transmural infarction (STEMI) but may be caused by extensive subendocardial ischemia (NSTEMI).
Establishing a diagnosis of Q-wave infarction requires that pathological Q-waves be present in at least two anatomically contiguous leads. In patients with STEMI, ST-segment elevations and pathological Q-waves occur in the same leads, which is why pathological Q-waves can be used to localize the infarct area.
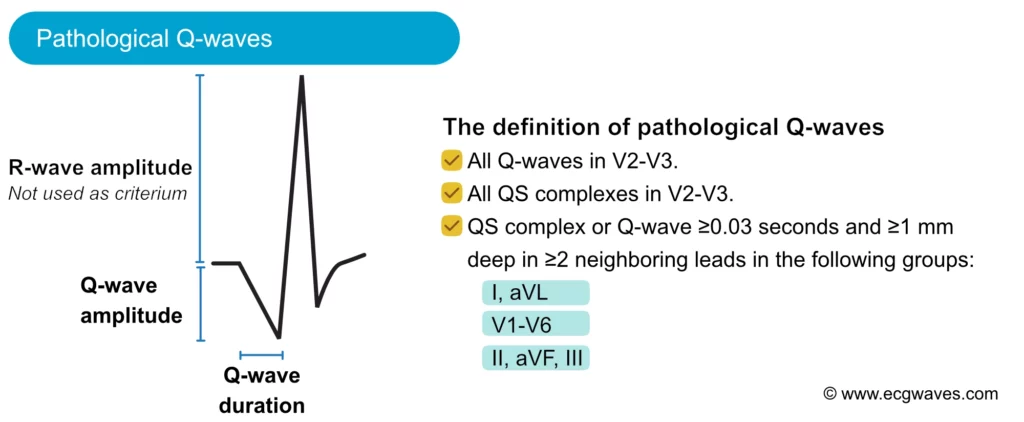
ECG criteria for pathological Q-waves (Q-wave infarction)
| Lead | Definition of pathological Q-wave | Normal variants |
|---|---|---|
| V2–V3 | ≥0,02 s or QS complex* | None |
| All other leads | ≥0,03 s and ≥1 mm deep (or QS complex) | Individuals with electrical axis 60–90° often display a small q-wave in aVL. Leads V5–V6 often display a small q-wave (called septal q-wave, explained in this article). An isolated QS complex is allowed in lead V1 (due to missing r-wave or misplaced electrode). Lead III occasionally displays a large isolated Q-wave; this is called a respiratory Q-wave, because its amplitude varies with respiration. Lead III may also display small Q-waves (not related to respiration) in individuals with electrical axis -30° to 0°. |
The following figure shows pathological Q-waves in two patients with acute STEMI.
Log in to view image, video, quiz, text

Pathological R-waves also indicate previous myocardial infarction
Current European (ESC) guidelines suggest that R-waves may also be used to diagnose previous myocardial infarction.
Criteria for pathological R-waves:
R-wave ≥0,04 s in V1-V2 and R/S ratio ≥1 with concordant positive T-wave in absence of conduction defect.
R/S ratio > 1 implies that the R-wave is larger than the S-wave.

