Exercise physiology: from normal response to myocardial ischemia & chest pain
Physiological principles of exercise stress testing, myocardial ischemia and ischemic symptoms
Understanding the basic principles of exercise physiology is essential to conduct and evaluate the exercise stress test. Exercise induces physiological changes such as increased ventilation, coronary vasodilation, increase in blood pressure, etc. The purpose of such changes is simply to enable the cardiopulmonary system to increase its delivery of oxygen to skeletal muscle and myocardium. The oxygen consumption – and thus oxygen demand – increases in parallel with the intensity of the exercise. The physiological changes (adaptations) become more pronounced as the intensity of exercise increases. The autonomic nervous system is the first system to react to exercise. It does so by withdrawing parasympathetic activity and increasing sympathetic activity. This has multiple effects which are discussed in detail below. This article will deal with the physiology of exercise and emphasis will be placed on myocardial oxygen consumption and the development of myocardial ischemia during exercise. ECG changes are mentioned briefly (an in-depth discussion on ECG changes is provided in the next article).
Physiological effects of exercise
The main physiological effects of exercise are summarized below.
Parasympathetic fibers innervate both the sinoatrial (SA) node and atrioventricular (AV) node. Parasympathetic stimulation reduces the automaticity in the sinoatrial node, which lowers the heart rate. The parasympathetic activity also diminishes impulse transmission in the AV node. Thus, withdrawal of parasympathetic activity results in increased heart rate and increased impulse transmission across the AV node.
Sympathetic fibers innervate the entire heart, particularly the ventricular myocardium. Sympathetic stimulation has a positive inotropic effect (i.e increases contractile force in the myocardium), positive chronotropic effect (i.e increases the heart rate by increasing the automaticity in the sinoatrial node), and positive bathmotropic effect (i.e increased impulse transmission through the myocardium). Thus, increased sympathetic activity results in increased heart rate and stronger contractions.
Physical exercise increases the venous return to the heart, which results in increased cardiac preload. The mechanisms are as follows:
- Sympathetic activity causes constriction of the veins, which increases the venous return to the heart.
- Contracting muscles function as a pump that propels blood back to the heart.
- The respiratory depth (volume) increases and this reduces the intrathoracic pressure by increasing the intrathoracic volume. Reduced intrathoracic pressure will passively suck blood back to the heart.
The increase in preload will lead to increased ventricular pressure and volume, which will, in turn, increase the stroke volume. This is explained by the Frank-Starling mechanism, which implies that the ventricular myocardium responds to increased ventricular pressure/volume by increasing its contractility. The Frank-Starling mechanism is amplified by the positive inotropic effects of the sympathetic stimulation. Increased stroke volume and increased heart rate lead to increased cardiac output.
Systolic blood pressure increases when cardiac output increases. Diastolic blood pressure is not affected by changes in cardiac output. Hence, diastolic blood pressure is not affected by exercise (occasionally it may even drop up to 10 mmHg). Mean arterial pressure (MAP) increases due to the fact that systolic blood pressure increases during exercise.
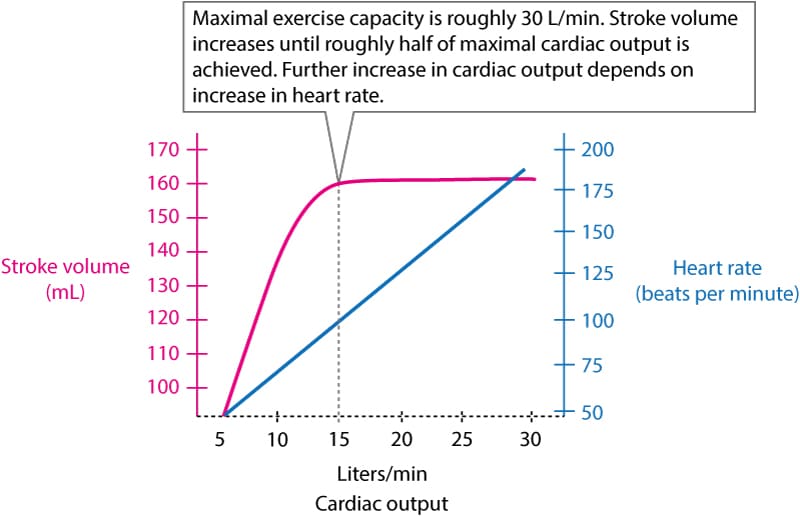
The increase in cardiac output during moderate exercise is the result of increased stroke volume and increased heart rate. However, when roughly half of the maximal cardiac output is achieved, the stroke volume cannot increase further, which means that a further increase in cardiac output depends on an increase in heart rate. As illustrated in Figure 1, cardiac output can increase 6 times during maximal exercise intensity.
Withdrawal of parasympathetic activity and increased parasympathetic activity cause vasoconstriction in the renal arteries, abdominal arteries and skin. Thereby, the blood volume is redirected to muscles, heart and brain, where arteries are instead dilated to allow for increased blood flow. Vasodilation in muscles, heart and brain is caused by catecholamines, nitric oxide (NO) and accumulation of metabolic waste products. Vasoconstriction in the kidneys, skin and abdomen is roughly equal to vasodilatation in the brain, heart and muscles. Ultimately, the peripheral vascular resistance is barely affected by exercise.
Heart rate during exercise stress testing
Heart rate must increase once exercise starts. Heart rate should then increase almost linearly with workload. Well-trained individuals, as well as persons using beta-blockers, exhibit a slower increase in heart rate. Maximal heart rate is lower in the elderly due to diminished sensitivity to catecholamines. Heart rate drops rapidly during the first minute of recovery (due to the return of vagal activity) and thereafter the heart rate drops slowly until it is normalized (return to baseline).
Blood pressure response during exercise stress testing
Systolic blood pressure should increase steadily during exercise. Virtually all patients display systolic blood pressure above 150 mmHg. Diastolic blood pressure is either unchanged or may drop slightly (up to 10 mmHg). Men and elderly individuals display a more pronounced increase in systolic blood pressure. Once the exercise stops, blood pressure drops steadily until it is normalized, which usually takes 5 minutes. Note that systolic blood pressure may actually drop below baseline levels after exercise and it may take up to 6 hours before it returns to baseline values.
Myocardial metabolism and ischemia (ischemia)
Understanding the principles of myocardial metabolism is crucial in order to understand how various situations may provoke myocardial ischemia and infarction. Myocardial ischemia occurs when myocardial oxygen demand exceeds the oxygen supply. In other words, ischemia is the result of an imbalance between oxygen demand and oxygen supply. This imbalance may be due to acute artery occlusion (i.e acute coronary syndrome), chronic but stable coronary artery stenosis (i.e. atherosclerosis) or other non-coronary causes such as anemia. The main determinants of myocardial oxygen consumption are the following:
- Blood pressure
- Heart rate
- Contractile force (contractility)
- Ventricular wall tension
Oxygen demand is positively correlated with each of these. In other words, if blood pressure, heart rate, contractility or wall tension increases, then myocardial oxygen demand will also increase. The term ventricular wall tension simply refers to the workload on the ventricular wall; it is determined by the pressure in the ventricle, myocardial thickness and diameter of the ventricle.
It is obvious that measuring contractility and wall tension is too laborious for routine clinical practice. Blood pressure and heart rate are much easier to assess and the product of these two parameters (heart rate × blood pressure) actually provides a reasonable estimate of the myocardial oxygen demand. The product is often referred to as the rate-pressure product (or double product, or cardiovascular product):
Rate Pressure Product = Heart Rate (bpm) × Systolic Blood Pressure (mmHg)
Thus, the rate pressure product is an estimate of the stress put on the myocardium. It is based on the number of contractions per minute (heart rate) and the pressure that the ventricle is pumping against (systolic blood pressure). The rate pressure product offers a simple way to estimate oxygen demand and thus energy consumption of the heart. The aim during exercise stress testing is to achieve a rate pressure product of at least 25000, which indicates that the workload has been sufficient.
| Hemodynamic response (workload) | Rate pressure product |
|---|---|
| High | >30000 |
| High intermediate | 25000 – 30000 |
| Intermediate | 20000 – 25000 |
| Low intermediate | 15000 – 20000 |
| Low | 10000 – 15000 |
Under normal circumstances, the coronary blood flow adapts to myocardial oxygen demand. Coronary blood flow increases during exercise in order to meet the increased oxygen demands in the myocardium. Myocardial ischemia occurs if there are atherosclerotic plaques that cause stenosis of the artery. Atherosclerotic plaques vary in size; they may range from negligible to completely obliterating. A small stenosis rarely causes symptoms at rest, but it may cause symptoms during exercise because oxygen demand increases during exercise (the stenosis prevents the needed increase in oxygen delivery). The rate pressure product may be used to estimate the severity of a stenosis; symptoms of ischemia (angina pectoris) at low rate pressure products indicate that the stenosis is severe. Moreover, in a stable stenosis, ischemic symptoms typically arise at the same rate-pressure product. The rate pressure product is, however, only an approximation of myocardial workload and some studies actually show that the patient’s subjective rating of her performance is at least as good an estimate of myocardial workload.
Myocardial ischemia: lack of blood flow vs. supply/demand imbalance
Ever since Eugene Braunwald and colleagues elucidated the determinants of myocardial oxygen demand, researchers have debated the true nature of myocardial ischemia. There are two competing theories (the first one has already been presented above) which are briefly explained:
- Most researchers have agreed on the supply and demand theory, which states that ischemia arises whenever demand exceeds supply. In other words, ischemia is the result of an imbalance between supply and demand.
- The competing theory states that the myocardium can never experience imbalance because it adapts its oxygen consumption (metabolism) to the oxygen supply. In other words, the myocardium will reduce its oxygen consumption – and thereby contractility – if sufficient oxygen is not available. Accordingly, myocardial cell metabolism follows the oxygen supply. Metabolism is downregulated gradually as the oxygen supply diminishes; the more pronounced the lack of oxygen, the greater the reduction in metabolism (and thus contractility). This theory is supported by both research and clinical observations. For example, animal studies and clinical studies show that whenever coronary blood flow is cut off, the affected myocardium immediately stops contracting and becomes “stunned”. As blood flow returns, the myocardium gradually resumes its contractions. According to this theory, myocardial ischemia can only be the result of an absolute lack of oxygen.
Interested readers are referred to:
• G Heusch, Myocardial Ischemia. Circ Res, 2016
• E Braunwald, Limitation of Infarct Size and the Open Artery Theory. Circulation, 2016.
Nevertheless, it is clear that the degree of stenosis correlates well with the level of ischemia. A stenosis causing <50% luminal obstruction may not cause any symptoms at all. A stenosis causing 50–70% luminal obstruction typically causes symptoms (angina pectoris) during exercise. A stenosis causing 90% luminal obstruction generally causes symptoms at rest. Note that these principles are modified by several factors, of which the most important are:
- Collateral circulation: Collateral arteries may be very effective. In fact, a complete occlusion of the left anterior descending artery (LAD) may not cause any symptoms if there are collateral vessels supplying the LAD.
- Location of the stenosis: A proximal occlusion/stenosis will affect a larger portion of the myocardium, as compared to a more distal occlusion/stenosis.
- Coronary autoregulation: Atherosclerotic coronary arteries tend to compensate for the stenosis by relaxing smooth muscle around the atherosclerotic plaque. This results in local vasodilation at the site of the plaque. Hence, in the early stages of atherosclerosis, the lumen (diameter) may not be affected by the plaque (which is why coronary angiography may also be false negative). However, as the atherosclerotic process continues and the plaque grows, it will gradually cause a narrowing of the lumen despite any autoregulatory mechanisms.
- The length of the stenosis: A long stenosis will have a greater impact than a short stenosis.
The ischemic cascade: from ischemia to ECG changes and chest pain
Patients with acute coronary syndromes who are monitored with continuous ST segment monitoring only report symptoms in approximately 40% of the ischemic episodes detected with continuous ST segment monitoring. It follows that 60% of ischemic episodes are asymptomatic, which in turn implies that ischemic heart disease cannot be ruled out by the absence of symptoms. On the other hand, patients with symptomatic ischemic heart disease (i.e. angina pectoris) will almost invariably display ischemic ECG changes during episodes with chest pain. In summary:
- 60% of all ischemic episodes are asymptomatic.
- Patients with chest pain due to myocardial ischemia will virtually always display ischemic ECG changes.
The ischemic cascade – which is the sequence of events that take place during an episode of ischemia – explains these matters. Figure 2 (below) illustrates the ischemic cascade. Study this figure carefully, as it clarifies why the absence of ischemic ECG changes during chest pain virtually rules out myocardial ischemia as the cause.
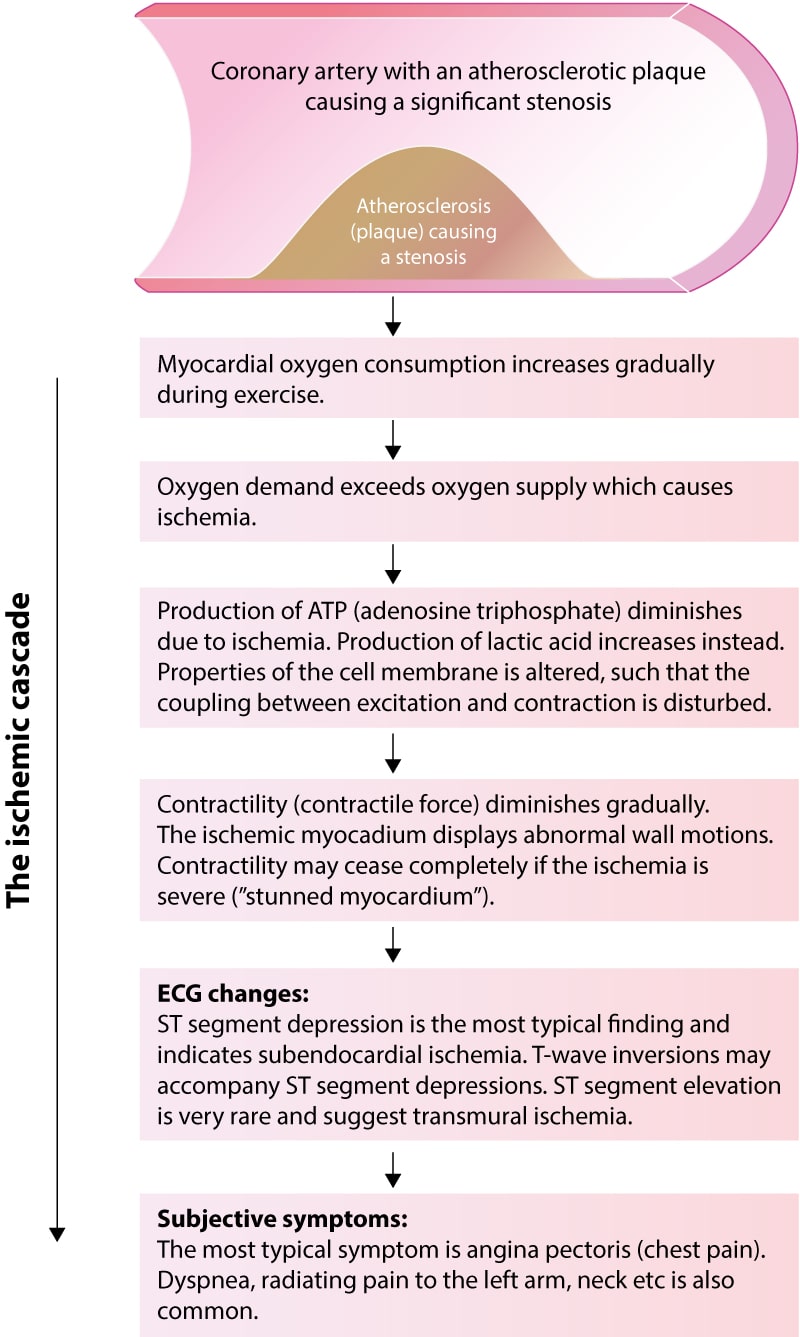
The ischemic cascade is the sequence of events that occur between the beginning of cellular ischemia and clinical symptoms. During exercise in patients with significant coronary artery stenosis, the myocardium receives less oxygen than is needed to meet the metabolic demands. The lack of oxygen results in diminished ATP (adenosine triphosphate) production and increased production of lactic acid. Diminished production of ATP leads to downregulation of cellular metabolism and contractility. The cell may actually stop contracting completely if the ischemia is severe. The term stunned myocardium refers to myocardium standing still due to severe ischemia. Downregulation of metabolism and contractility is necessary for the cell to survive ischemia (the consequence of ischemia would be more severe if the cellular processes had continued unaltered during ischemia). The diminished availability of ATP affects the cell membrane proteins (particularly ion channels). This ultimately results in altered cell membrane function and changes in the electrical potentials across the cell membrane, which in turn causes ST segment depressions. Clinical symptoms (notably chest pain) arise if the ischemia is allowed to continue. This sequence of events is outlined in Figure 2 above. Note the following:
- There is a limit for how long the cell can survive ischemia, even if it downregulates metabolism. In general, the myocardium survives severe ischemia for 20 minutes before the ischemic cells die.
- The ischemia only causes ECG changes if it affects enough myocardium. ECG changes occur before clinical symptoms. In other words, clinical symptoms (e.g. chest pain) are the last events during an ischemic episode. It follows that myocardial ischemia may be present even in the absence of clinical symptoms. The ECG detects more ischemic episodes than the patient experiences.

