Echocardiography in 2D
Two-dimensional (2D) ultrasound is the most commonly used modality in echocardiography. The two dimensions presented are width (x axis) and depth (y axis). The standard ultrasound transducer for 2D echocardiography is the phased array transducer, which creates a sector shaped ultrasound field (Figur 1).
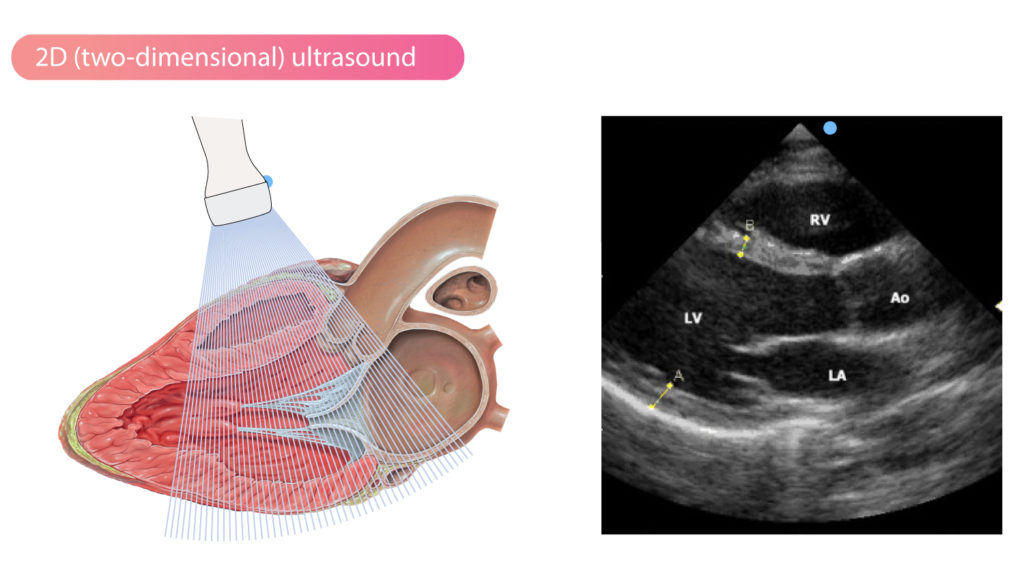
The image sector is created using sequential activation of the piezoelectric crystals. The crystals are activated from one side to the other, as illustrated in Figure 2. The sequence of activation goes from right to left and then from left to right, and this is repeated rapidly. To create an image sector of 90° width and 15 cm depth, approximately 200 ultrasound lines are required and this takes about 40 milliseconds (ms) to generate. As illustrated previously (Axial and lateral resolution of the ultrasound image) line density diminishes with increasing distance from the transducer.
The phased array transducer and its sector shaped ultrasound field are suitable for echocardiography since the ultrasound field can pass the ribs and then spread over a larger area. The focus can be adjusted by varying the sequence of activation of the piezoelectric crystals. The density of the ultrasound lines decreases with increasing distance from the transducer; this affects the lateral resolution as explained in Figure 3.
Frame rate
The two-dimensional image must be updated rapidly and continuously in order to obtain a movie. The speed at which the images are updated is crucial for producing a high-resolution movie. The rate of update is described by the technical term frame rate, which is the number of images (frames) displayed per second. High frame rate (i.e many frames per second) is desirable because it provides better temporal resolution.
Frame rate depends on several factors. The elapsed time for all ultrasound waves to be emitted, reflected and processed in the machine determines the frame rate. As mentioned above, using 200 ultrasound lines to create a 90° wide and 15 cm deep image requires approximately 40 milliseconds (ms). Increasing the number of ultrasound lines or image depth will reduce the frame rate since more time is required to complete each frame. Thus, the temporal resolution is reduced by enlarging the image sector. The opposite is also true; frame rate, and thus temporal resolution, can be increased by reducing image depth or reducing the width of the sector. To achieve the highest resolution possible, the depth and width of the image should be kept as small as possible. The ultrasonic machine has controls to adjust width and depth. It is also possible to adjust the frame rate to a certain extent.
The ultrasound image
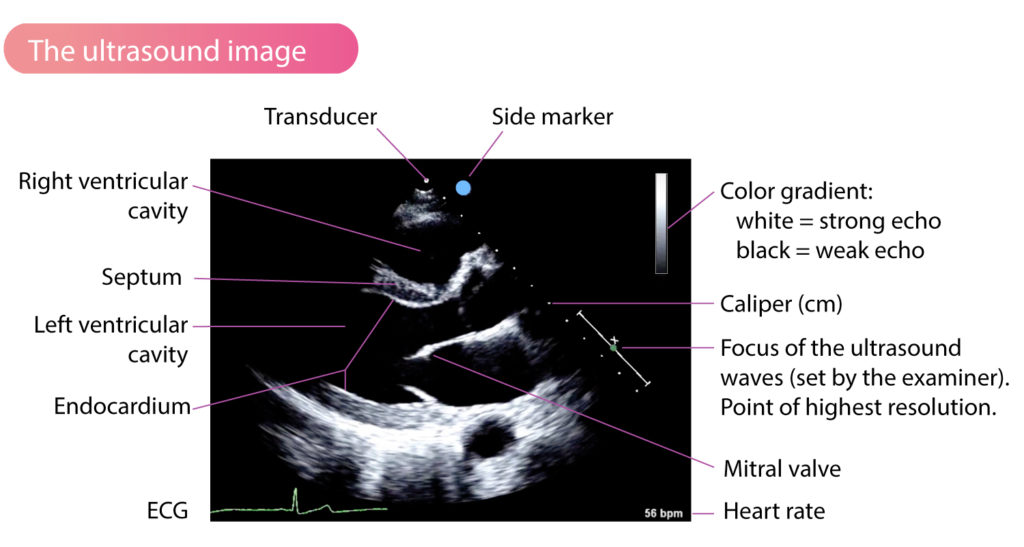
The ultrasound image contains several important parameters (Figure 4). The ECG signal is presented at the bottom and it is used to identify diastole and systole, which is necessary to perform various measurements. The transducer itself is not seen in the image but the contour of the lens is seen at the very top of the sector field (the dark area). Figure 4 shows a blue (the color may vary depending on manufacturer and user settings) circle next to the transducer; this is the side indicator that assists the examiner to identify left and right in the image. This indicator corresponds to the indicator on the transducer.
Focus of the ultrasound beams
The highest resolution on the ultrasound image is located where the width of the ultrasound beam is narrowest and this point is called focus. It is possible to adjust the position of focus without moving the transducer; focus is shfited by modifying the sequence of activation of the piezoelectric crystals.
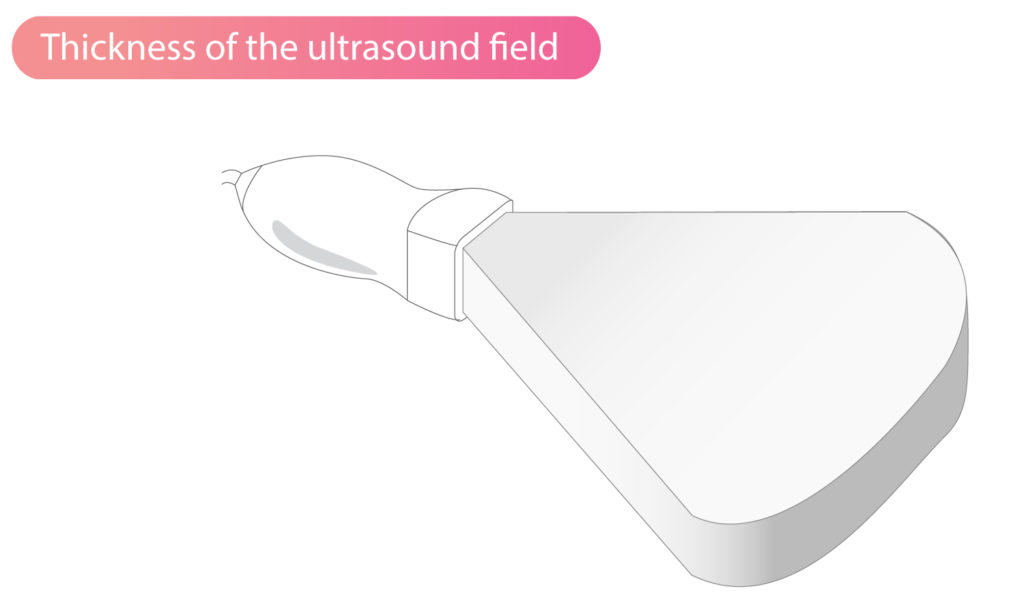
Although two-dimensional ultrasound images (e.g Figure 4) suggest that the ultrasound beam is flat, in reality, the ultrasound beam is 2 to 10 mm thick (Figure 5). The ultrasound image presented is a flattened version of the original three-dimensional ultrasound beam. Hence, structures that are not actually located next to each other can be placed next to each other on the two-dimensional image.

