Mitral regurgitation
Causes of mitral regurgitation
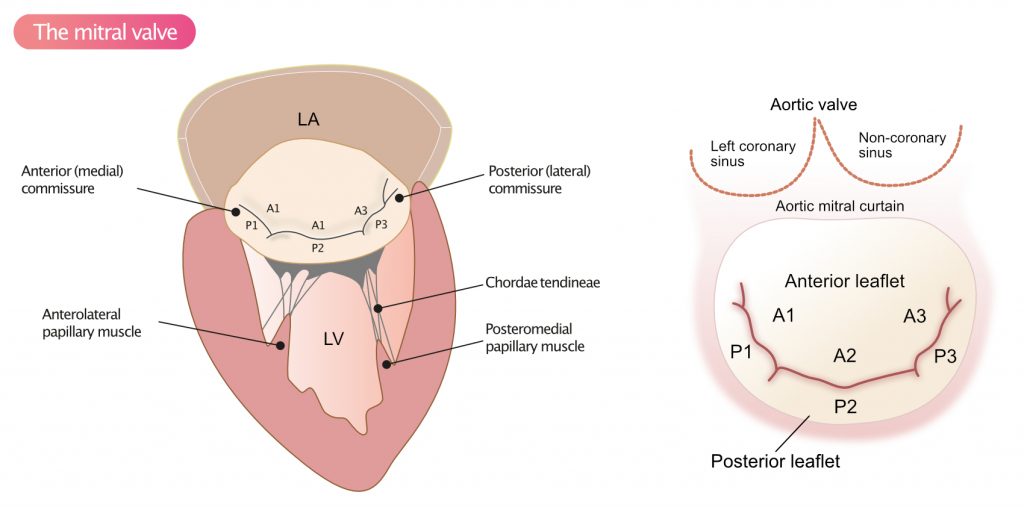
The most common cause of mitral regurgitation in high-income countries is age-related degeneration of the valvular apparatus. Age-related degeneration affects 2% of the population and leads to gradual prolapse of the valve leaflets (Figure 1). Rheumatic heart disease is the leading cause of mitral regurgitation in low- and middle-income countries. Rheumatic heart disease typically results in thickening of the leaflets and may coexist with mitral stenosis.
Idiopathic degeneration (Barlow’s disease), degeneration associated with connective tissue disorders (Marfan syndrome, Ehlers-Danlos syndrome), osteogenesis imperfecta typically causes prolapse of P2 (Figure 1).
Myocardial ischemia affecting the papillary muscles or the connected myocardium may cause mitral prolapse, and thus regurgitation. Ischemia manifests with myocardial akinesia or dyskinesia, which impairs papillary muscle function. Likewise, myocardial infarction affecting the papillary muscle or its connected myocardium may also result in mitral prolapse. Extensive myocardial infarction may lead to papillary muscle rupture. The risk of rupture is greater for the posteromedial papillary muscle, which only receives blood supply from one coronary artery (Coronary arteries).
Chronic myocardial ischemia may also lead to left ventricular dilation, which is referred to as ischemic cardiomyopathy (Dilated Cardiomyopathy). Ventricular dilation leads to dilation of the mitral annulus and papillary muscle displacement (i.e the distance between the papillary muscle and the mitral annulus increases), both of which lead to regurgitation. Table 1 presents the most common causes of mitral regurgitation.
| Table 1. Causes of mitral regurgitation |
| Degeneration, prolapse |
| DCM (dilated cardiomyopathy) |
| Ischemic heart disease (coronary heart disease) |
| Rheumatic valve disease |
| Endocarditis |
| Congenital mitral regurgitation |
| Amyloidosis |
| SLE |
| Hypertrophic obstructive cardiomyopathy (HOCM) |
| Rupture of papillary muscle |
| Rupture of chordae tendineae |
Acute mitral regurgitation
Acute mitral regurgitation is relatively rare. The most common causes are as follows:
- Endocarditis
- Papillary muscle rupture (complication of acute myocardial infarction)
- Rupture of chordae tendineae.
Acute regurgitation of blood into the left atrium results in sudden volume and pressure overload in the atrium, leading to increased LAP (left atrial pressure). However, left ventricular end-diastolic pressure (LVEDP) also rises; the left ventricle becomes volume overloaded since less blood is ejected into the aorta. Thus, acute regurgitation results in a sudden increase in preload, which the ventricle counteracts by increasing heart rate and stroke volume (Preload, Afterload, Stroke Volume and Frank Starling’s mechanism). Compensatory mechanisms may alleviate the condition temporarily, but the elevated left atrial pressure will rapidly propagate to the pulmonary circulation and cause pulmonary edema. Also, left ventricular exhaustion results in diminished cardiac output, potential hypotension and cardiogenic shock.
Chronic mitral regurgitation
Chronic mitral regurgitation causes a gradual volume and pressure overload, such that LVEDP and LAP rise slowly. This leads to compensatory dilatation of chambers. The mechanism underlying ventricular and atrial dilation proceeds from Laplace’s law, which states that increased pressure results in increased wall stress, which can be alleviated by ventricular hypertrophy and dilation:
Wall stress = (PressureLV × radiusLV) / (2 × WTLV)
LV = left ventricle; WT = wall thickness
Laplace’s law shows that wall stress can be reduced by increasing wall thickness, which is equivalent to developing hypertrophy. The ventricle also dilates, which reduces the volume overload.
According to the Frank-Starling mechanism, stroke volume increases to handle the increase in preload. Stroke volumes may be supranormal in the early stages of mitral regurgitation. However, continuing dilation results in a successive increase in regurgitation, and, thus, deteriorating ventricular function. Contractile dysfunction commences, leading to reduced left ventricular ejection fraction (EF). Ultimately, mitral regurgitation results in pulmonary hypertension, pulmonary edema and systolic heart failure.
Chronic mitral regurgitation ultimately causes pulmonary hypertension, pulmonary edema and systolic heart failure.
Echocardiographic assessment of mitral regurgitation
Key points 2D assessment
- Assess the leaflets, chordae tendineae, papillary muscles.
- Are all structures visible and intact?
- Calcifications?
- Ruptures papillary muscles or chordae tendineae?
- Vegetations?
- Assess the left ventricle:
- Structure (dimensions) and function?
- Assess the left atrium:
- Atrial dimension?
- Assess the mitral annulus:
- Dilated mitral annulus? Calcifications?
- Prolapse: If the valve bulges >1 mm (during systole) into the atrium, there is prolapse.
- Prolapse of the posterior leaflet results in an anteriorly directed regurgitant jet.
- Prolapse of the anterior leaflet results in a posteriorly directed regurgitant jet.
- Left ventricular dilation results in the papillary muscles being pulled further away from the mitral annulus. This impairs leaflet coaptation, which is evident in the ultrasound image as tenting. Tenting is quantified by measuring the height from the valvular plane to the tips, where the leaflets coapt.
- Flail leaflets: ruptured or prolonged chordae results in the leaflets swinging back into the left atrium.
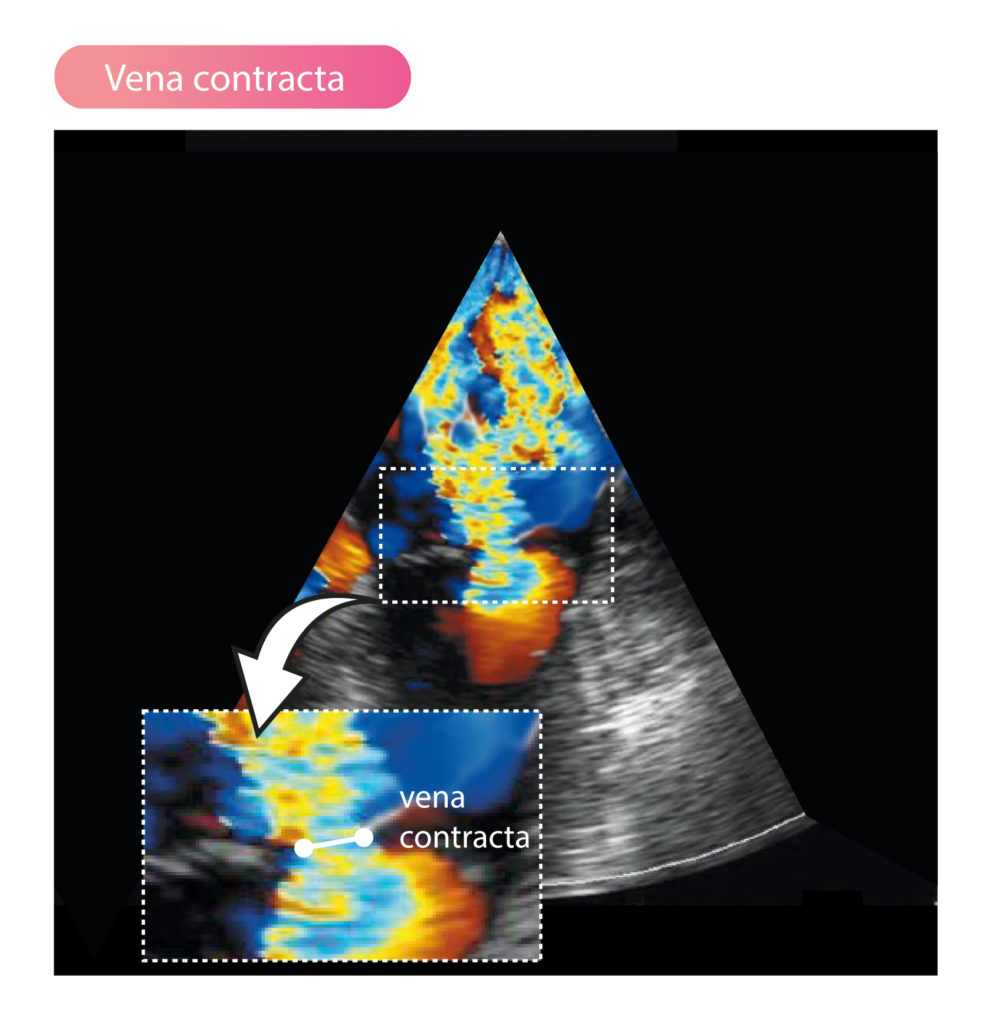
Vena contracta
Vena contracta is the narrowest part of the regurgitant jet and reflects the regurgitant orifice area. The measurement is acquired in parasternal long-axis view (PLAX) with the valve zoomed. Degree of regurgitation can be estimated using the diameter of vena contracta, as follows:
- Vena contracta <3 mm: mild regurgitation.
- Vena contracta >7 mm: severe regurgitation.
Vena contracta may be used to estimate severity of the regurgitation if the orifice (regurgitant area) is circular. Mean value of vena contracta measured in several views may be used.
PISA (Proximal Isovelocity Surface Area)
Using PISA (proximal isovelocity surface area), the area and volume of the regurgitation may be calculated. The measurement is acquired in apical four-chamber view (A4C) with the valve area zoomed. Color Doppler is used to visualize vena contracta, PISA and the jet. The baseline is adjusted (between 14 cm/s and 40 cm/s) until PISA assumes the shape of a semicircle. The largest PISA radius during systole is measured. Maximum velocity and VTI across the mitral valve is obtained using continuous wave doppler. The regurgitant orifice area is calculated using the following formula:
EROA = 2 × 𝛑 × rPISA2 × valiasing / vmax MR jet
EROA = effective regurgitant orifice area; MR = mitral regurgitation.
Calculating the regurgitant volume
The regurgitant volume (Vregurg) can be calculated using the following three methods.
Method 1: Pulsed wave doppler
Pulsed Doppler can estimate the regurgitant volume (milliliters, ml) by calculating the difference between transaortal blood volume (Vaorta) and transmitral blood volume (Vmitral), according to the following formula:
Vregurg = Vmitral – Vaorta
Transaortal and transmitral flow are calculated using each respective valve area and VTI (pulsed Doppler):
Vaorta = areaLVOT x VTILVOT
Vmitral = areamitral x VTImitral
This method is not applicable in the setting of severe aortic regurgitation. In most cases, however, it is sufficient to take the ratio of VTImitral and VTILVOT:
VTImitral / VTILVOT
This is the ratio of the mitral inflow and the flow across the aorta. A ratio of >1.4 strongly suggests severe regurgitation. A ratio of <1.0 indicates a mild regurgitation.
Method 2: difference in stroke volume
The stroke volume can be estimated using Simpson’s modified method:
LVSV = LVEDV-LVESV
LVSV = left ventricular stroke volume; LVEDV = left ventricular end-diastolic volume; LVEDV = left ventricular end-systolic volume.
This formula estimates the volume ejected from the left ventricle, but it does not consider the direction of the blood flow (i.e whether it flows through the aortic valve and/or the mitral valve). Therefore, we also obtain the volume flowing through LVOT (SVLVOT), and subtract it from LVSV, which yields the volume leaking back into the left atrium.
Start by calculating the volume flowing across the LVOT:
SVLVOT = areaLVOT × VTILVOT
Calculate the regurgitant volume by subtracting SVLVOT from the total stroke volume:
Vregurg = LVSV – SVLVOT
Method 3: PISA
EROA = 2 × 𝛑 × rPISA2 × valiasing / vmax MR jet
Vregurg = EROA × VTIMRjet
The regurgitant fraction (Fregurg) can be calculated as follows:
Fregurg = Vregurg / SVtotal
SVtotal = areamitral annulus × VTImitral annulus
Other echocardiographic findings in mitral regurgitation
- High LAP (left atrial pressure) yields higher E-wave velocity.
- In severe mitral regurgitation, systolic reversal is seen in the pulmonary veins.
- Pulmonary pressure is always increased in severe mitral regurgitation.

