Clinical Echocardiography
-
Introduction to echocardiography and ultrasound imaging12 Chapters
-
Physics of ultrasound
-
The ultrasound transducer
-
Technical aspects of the ultrasound image
-
Two-dimensional (2D) echocardiography
-
Optimization of the ultrasound image
-
M-mode (motion mode) echocardiography
-
Doppler effect and Doppler echocardiography
-
Pulsed Wave Doppler
-
Continuous Wave Doppler (CW Doppler)
-
Color Doppler
-
Tissue Doppler (Tissue Velocity Imaging)
-
Artifacts in ultrasound imaging
-
Physics of ultrasound
-
Principles of hemodynamics5 Chapters
-
The echocardiographic examination3 Chapters
-
Left ventricular systolic function and contractility11 Chapters
-
Left Ventricular Function
-
Myocardial Mechanics: Structure and Function of Myocardial Fibers
-
Ventricular Pressure-Volume Relationship: Preload, Afterload, Stroke Volume, Wall Stress & Frank-Starling's law
-
Assessing left ventricular systolic function
-
Left ventricular mass and volume (size)
-
Ejection fraction (EF): Physiology, Measurement & Clinical Evaluation
-
Fractional shortening for estimation of ejection fraction
-
Strain, strain rate and speckle tracking: Myocardial deformation
-
Left Ventricular Segments for Echocardiography and Cardiac Imaging
-
The Coronary Arteries
-
Regional Myocardial Contractile Function: Wall Motion Abnormalities
-
Left Ventricular Function
-
Left ventricular diastolic function3 Chapters
-
Cardiomyopathies6 Chapters
-
Heart failure: Causes, types, diagnosis, treatments & management
-
Echocardiography in cardiomyopathies: an overview
-
Hypertrophic Cardiomyopathy (HCM) & Hypertrophic Obstructive Cardiomyopathy (HOCM)
-
Dilated Cardiomyopathy (DCM): Definition, Types, Diagnostics & Treatment
-
Arrhythmogenic Right Ventricular Cardiomyopathy / Dysplasia (ARVC, ARVD)
-
Tachycardia induced cardiomyopathy
-
Heart failure: Causes, types, diagnosis, treatments & management
-
Valvular heart disease8 Chapters
-
Miscellaneous conditions5 Chapters
-
Pericardial disease2 Chapters
Color Doppler
Color Doppler
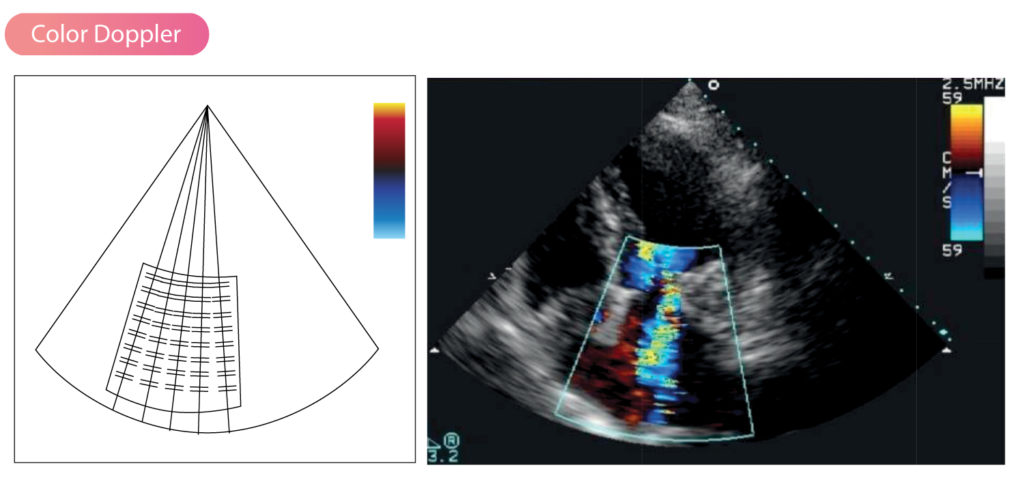
Velocities recorded in a sample volume of the pulsed wave Doppler can be presented with a color. A color scale from blue to red is conventionally used. Blue color implies velocities (movement) away from the transducer and red color implies velocities (movement) towards the transducer. If many sample volumes are placed along several Doppler lines, then all velocities in the area can be presented with colors. The brighter the color, the higher the velocity. As shown in Figure 1, the Doppler sector is superimposed on the 2D image to facilitate the interpretation of the Doppler signals.
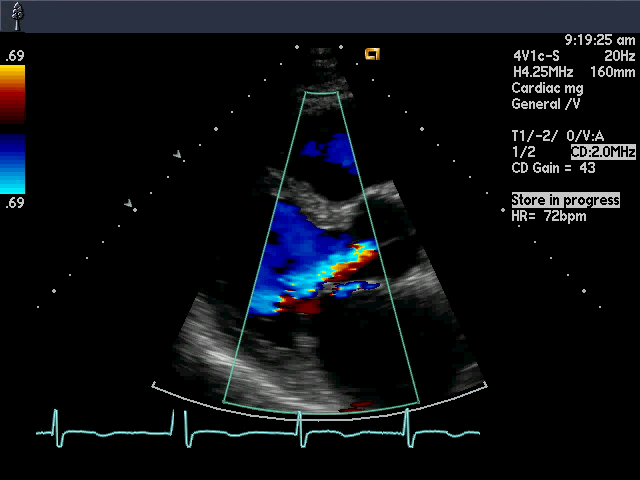
The main advantage of color Doppler is that it allows for rapid visualization of flows, velocitites and volumes. This is useful for detecting valvular regurgitation and defects in the atria or ventricles (Figure 2). In addition, color Doppler can be used to align the continuous Doppler.
Because color Doppler is a type of pulsed wave Doppler, it is limited by the Nyquist limit. In fact, color Doppler is limited more by the Nyquist limit (as compared with standard pulsed wave Doppler), which is explained by the fact that the pulse repetition frequency (PRF) is reduced when obtaining both a 2D image and Doppler signals simultaneously. If the blood flow velocity exceeds the Nyquist limit, aliasing occurs and the signal changes color (blue turns red, and red turns blue). Aliasing usually occurs at speeds above 0.5 m/s. Aliasing can be reduced by minimizing the distance between the transducer and the color sector (where sample volumes are recorded) and by using the smallest possible sector.
Note that color Doppler presents the average velocity in each sample volume (i.e not the maximum velocity). Large variations in velocities recorded within a single sample volume indicate turbulent flow; the ultrasound machine is programmed to depict such flows with green color to indicate that the flow is turbulent. Figure 1 displays green areas within the Doppler sector.

