Ejection fraction (EF): Physiology, Measurement & Clinical Evaluation
Ventricular ejection fraction (EF)
For several decades, ejection fraction (EF) has been the dominating method for assessing left ventricular systolic function. Ejection fraction is simple to calculate; if the left ventricle contains 100 ml of blood at the end of diastole and 40 ml is pumped out during systole, then the ejection fraction is 40%. Thus, the ejection fraction is the stroke volume (SV) divided by the end-diastolic volume (EDV):
EF (%) = (SV/EDV)·100
EF = ejection fraction
Since stroke volume (SV) is the difference between end-diastolic volume (EDV) and end-systolic volume (ESV), EF can also be calculated as:
EF (%) = [(EDV-ESV)/EDV]·100
Normal values for ejection fraction (EF)
Studies in healthy individuals suggest that the mean ejection fraction is 63% to 69%. European and American guidelines concur that the lower normal limit for ejection fraction is 55%. Reduced ejection fraction is defined as ejection fraction <55%. This implies that left ventricular pumping capacity is reduced and it is synonymous with heart failure with reduced ejection fraction (HFREF).
| Average ejection fraction | 63% to 69% |
| Lower normal limit | 55% |
Ejection fraction is routinely examined at rest, which does not reveal the functional (maximum) capacity of the left ventricle, as this would require measuring the ejection fraction during submaximal exercise testing. Ejection fraction reserve is the available reserve in ejection fraction that can be generated during exercise.
Effect of preload and afterload on ejection fraction
Ejection fraction is highly dependent on preload and afterload. A rapid increase in preload (e.g by increasing venous return to the heart in supine position) leads to an immediate increase in ejection fraction. Similarly, a decrease in afterload (e.g by means of decreased resistance in the systemic circulation) leads to an increase in ejection fraction. The opposites are also true; decreased preload results in reduced ejection fraction, and increased afterload results in reduced ejection fraction.
Since ejection fraction is affected by preload and afterload, it is necessary to consider loading conditions when evaluating the measured ejection fraction. Ideally, ejection fraction should be assessed during normal, with regards to the patient, loading conditions. If repeated echocardiograms yield pronounced variations in ejection fraction, then it is likely that variations in preload and afterload, rather than changes in contractile function, explains the varying ejection fraction.
Ejection fraction and left ventricular volume
Ejection fraction is also affected by left ventricular volume (size). For example, athletes have large ventricular dimensions and often lower ejection fraction, as compared with non-athletes. This is explained by the fact that the athlete’s heart produces significantly larger stroke volumes, which satisfy the body’s oxygen demand despite smaller ejection fractions.
In general, individuals with small ventricular volumes tend to have high ejection fractions. This inverse relationship appears to be a compensatory mechanism, such that small ventricular volumes are compensated with greater ejection fractions.
The significance of ventricular size becomes obvious in the setting of hypertrophic cardiomyopathy (HCM, HOCM). Individuals with hypertrophic cardiomyopathy may display normal, or supranormal ejection fraction, despite manifest heart failure and severe symptoms. These individuals exhibit pronounced hypertrophy, resulting in a reduction of ventricular volume and subsequently an increase in ejection fraction. Stroke volumes are generally reduced in hypertrophic cardiomyopathy.
Reduced ejection fraction
Numerous conditions can lead to reduced ejection fraction. Cardiomyopathy, valvular heart disease, diabetes, hypertension, renal failure, ischemic heart disease (coronary heart disease) are among the common causes. The mechanisms leading to deterioration in ejection fraction vary for these conditions. Two examples follow.
AORTIC VALVE REGURGITATION – In the setting of aortic valve regurgitation, blood regurgitates from the aorta back to the left ventricle. This results in ventricular volume overload, which the ventricle attempts to counteract by dilating and developing hypertrophy. The dilatation prevents the volume overload from causing pressure overload, and the development of hypertrophy enables the ventricle to eject larger volumes of blood. Thus, dilatation and hypertrophy mitigate the consequences of volume overload. Unfortunately, the long-term effects of dilatation and hypertrophy are remodeling of the myocardium and neurohormonal disturbances that gradually impair contractility and lead to the development of myocardial fibrosis. Ultimately, contractility of individual muscle fibers worsen and ejection fraction deteriorates.
CORONARY ARTERY DISEASE – Coronary heart disease may lead to acute myocardial infarction, which implies that some myocardium permanently ceases to contract, and overall ejection fraction is reduced.
As evident from these examples, the mechanisms leading to reduced ejection fraction may vary substantially. However, once ejection fraction has been reduced, the natural course is strikingly similar across all etiologies. Impaired ejection fraction triggers neurohormonal mechanisms (see below) that are initially beneficial, but in the long run cause deterioration of the condition. Symptoms of heart failure (eg, dyspnea, impaired performance, edema, etc.) develop sooner or later.
Neurohormonal activation in heart failure with reduced ejection fraction
Reduced ejection fraction leads to reduced cardiac output. High-pressure baroceptors in the left ventricle, aortic arch, and carotid sinus detect reductions in cardiac output and respond by increasing their afferent signaling to vasomotorcenter in the central nervous system (CNS). Activation of the vasomotorcenter results in increased activity in efferent sympathetic pathways that innervate the heart, skeletal muscle, kidney and peripheral vasculature. Activation of the vasomotorcenter also lead to increased secretion of vasopressin from the posterior pituitary gland (Figure 2).
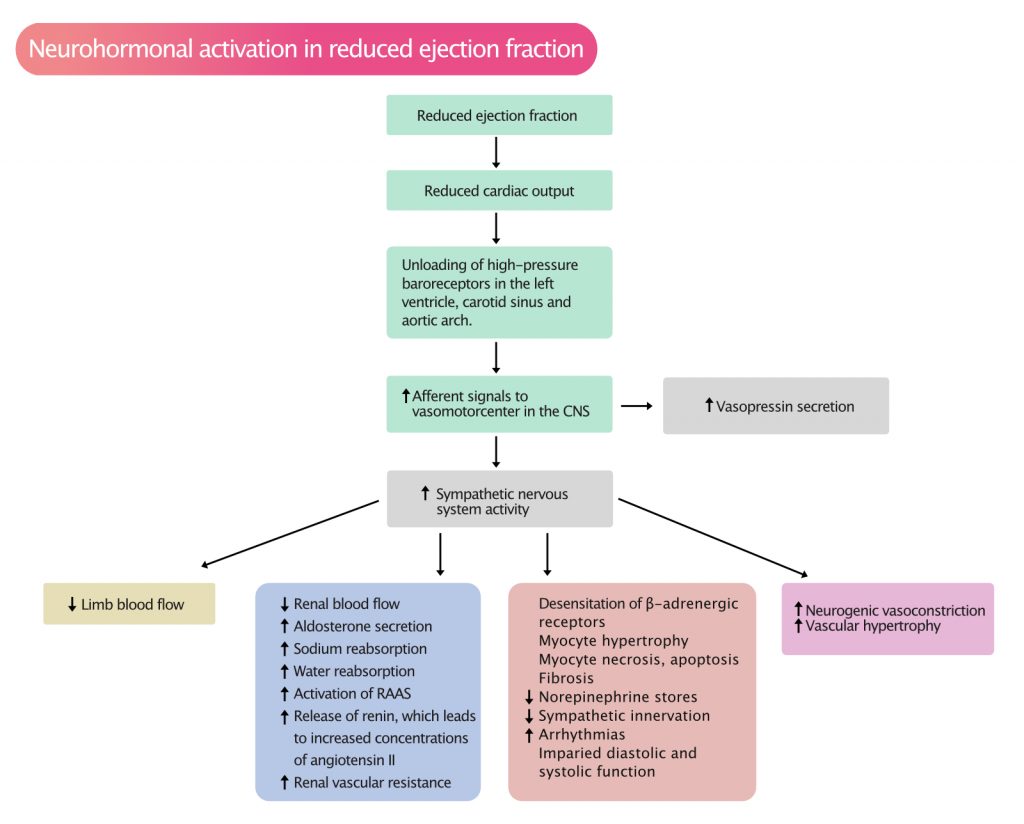
As evident in Figure 2, a range of neurohormonal mechanisms is triggered when ejection fraction is reduced. These mechanisms and their consequences include:
- Increased sympathetic activity leads to increased heart rate and initially increased contractility, which may temporarily alleviate symptoms, but the long-term effects of sympathetic activity are devastating. Beta-blockers, which reduce the activity of sympathetic fibers, improve both cardiac function and survival dramatically in heart failure.
- Increased sympathetic activity leads to increased secretion of aldosterone, renin (activation of RAAS) and consequently increased concentrations of angiotensin II. This results in increased blood pressure and retention of salt and water. This subsequently results in increased cardiac preload and, in the long term, volume overload.
- In cardiac muscle, sympathetic activity results in desensitization of beta-adrenergic receptors, diminished norepinephrine stores, hypertrophy, fibrosis, apoptosis and increased risk of arrhythmias. Ultimately, this leads to further impairments in systolic and diastolic function.
- Sympathetic stimuli to peripheral vessels result in hypertension and vascular hypertrophy.
- When compensatory mechanisms are not sufficient to maintain normal intraventricular pressure, ventricular dilatation commences. The dilatation may initially lead to increased contractility in individual muscle fibers (refer to Frank-Starling’s law), but contractile function deteriorates gradually.
Visual estimation of ejection fraction
Ejection fraction can be estimated visually. This means that the ejection fraction is estimated by means of eyeballing the two-dimensional video clips. This method is obviously subjective and requires a substantial amount of experience. However, studies (Gudmundsson et al) indicate that eyeballed ejection fraction correlates well with quantitative assessments of ejection fraction.
Calculation of ejection fraction with quantitative methods
Objective estimation of ejection fraction requires measurements in M-mode or two-dimensional (2D) echocardiography. Measurements in M-mode are based on two brave assumptions: (1) ventricular geometry must be perfectly normal and (2) there must not be regional differences in contractile function. These assumptions are frequently violated, such that M-mode is inferior to 2D echocardiography. Thus, 2D methods are preferred for the calculation of ejection fraction. Several methods are available, of which the best validated and most widely used is Simpson’s method.
Simpson’s biplane method for calculation of ejection fraction (EF)
Simpson’s biplane method requires making four simple measurements in order to obtain end-diastolic volume (EDV) and end-systolic volume (ESV), which are then used to calculate ejection fraction:
EF (%) = [(EDV-ESV)/EDV]·100
Simpson’s method is presumably the best 2D method for estimating left ventricular EDV and ESV, and thus ejection fraction. This method is less dependent on the geometry of the ventricle, as compared with M-mode.
Simpson’s biplane method requires tracing (i.e drawing a line along) the endocardium in apical four-chamber view (A4C) and apical two-chamber view (A2C) in diastole and systole. The entire endocardium, from mitral annulus to mitral annulus must be traced (Figure 3). The ultrasound system then divides the area into a number of equal disks and reconstructs these so that volumes can be calculated.
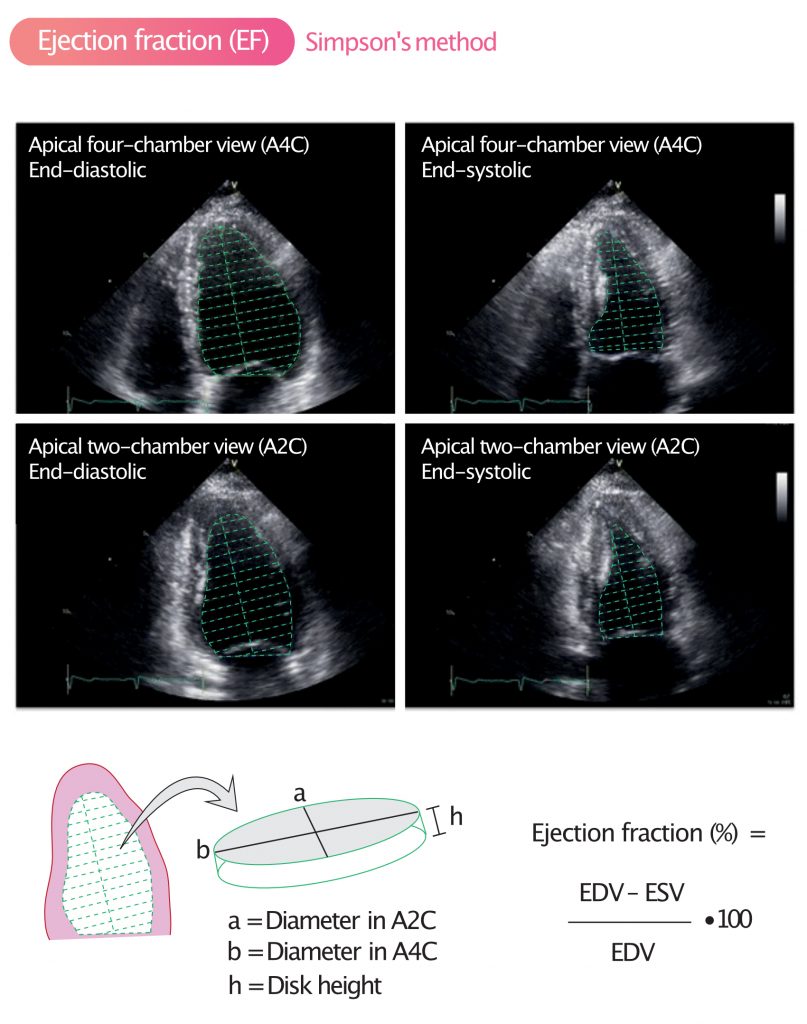
The term biplane means that the measurements are made in two planes, namely A4C and A2C. As mentioned above, the formula used to calculate ejection fraction is as follows:
EF (%) = [(EDV–ESV)]/EDV·100
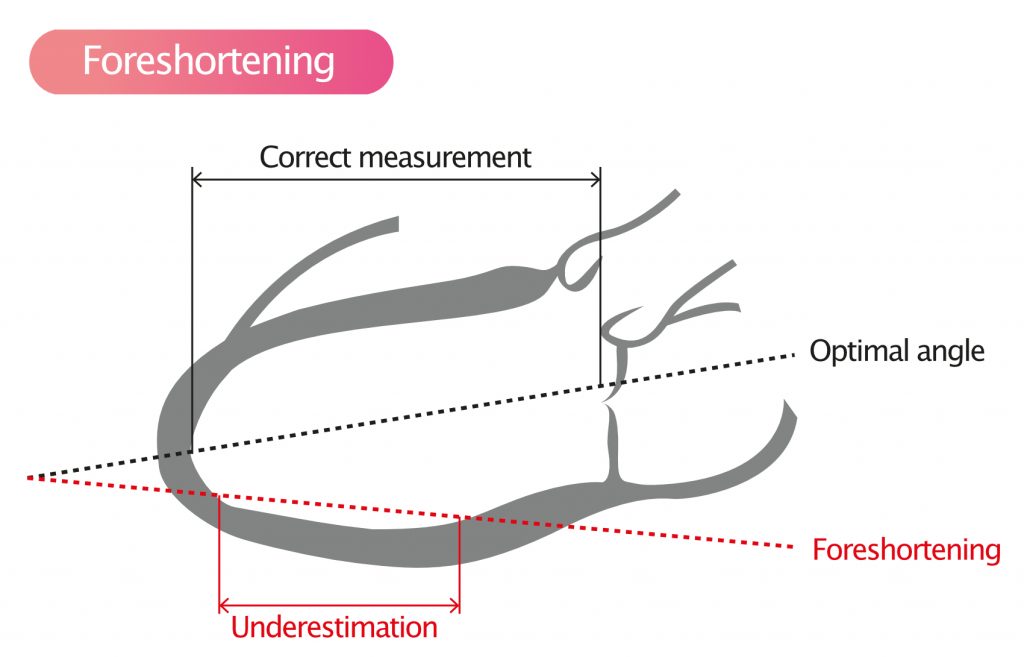
Foreshortening and underestimation of ejection fraction
When visualizing the left ventricle from apical windows, small angle errors may lead to large differences in ventricular dimensions. Actually, all angle errors lead to underestimation of ventricular volumes. This is evident in Figure 4, which illustrates how angle errors lead to foreshortening.
References
Hartupee et al (2017): Neurohormonal activation in heart failure with reduced ejection fraction. Nature Reviews Cardiology (2017).
Gudmundsson et al: Visually Estimated Left Ventricular Ejection Fraction by Echocardiography Is Closely Correlated With Formal Quantitative Methods (2005).

