The ST segment: physiology, normal appearance, ST depression & ST elevation
The ST segment corresponds to the plateau phase of the action potential (Figure 13). The ST segment extends from the J point to the onset of the T-wave. Because of the long duration of the plateau phase most contractile cells are in this phase at the same time (more or less). Moreover, the membrane potential is relatively unchanged during the plateau phase. These two factors are the reason why the ST segment is flat and isoelectric (i.e in level with the baseline).
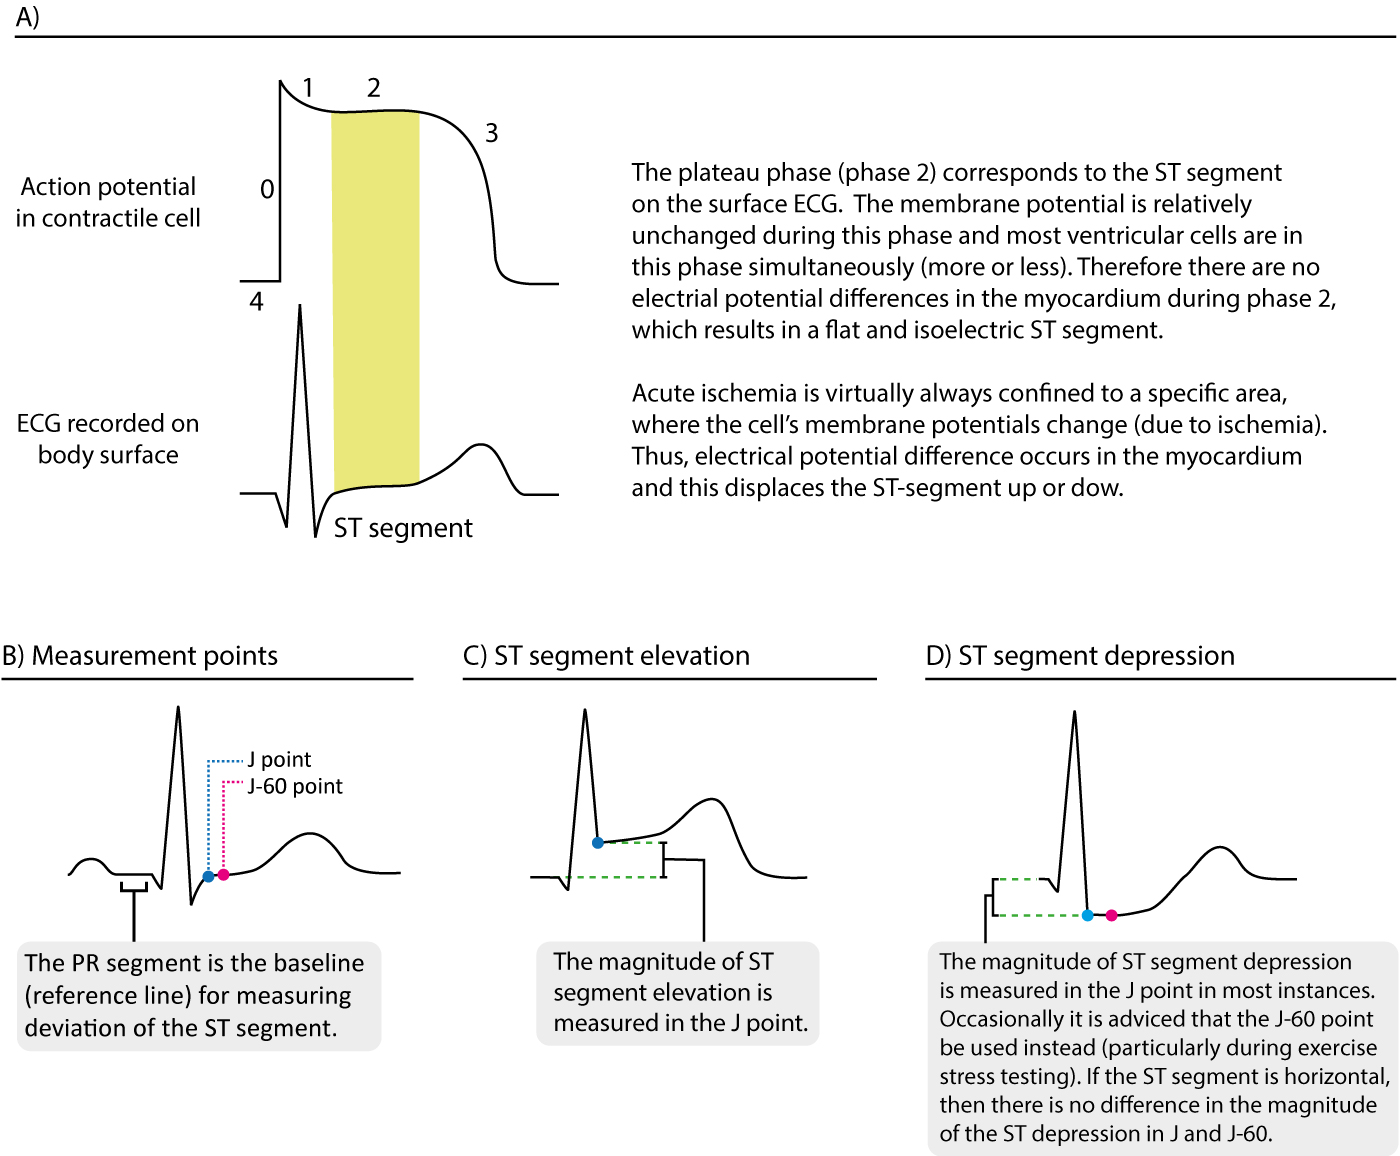
Displacement of the ST segment is of fundamental importance, particularly in acute myocardial ischemia. Because myocardial ischemia affects a limited area and disturbs the cells’ membrane potential (during phase 2), it engenders electrical potential difference in the myocardium. The electrical potential difference exists between ischemic and normal myocardium and it results in displacement of the ST segment. The ST segment may be displaced upwards (ST segment elevation) or downwards (ST segment depression). The term ST segment deviation refers to elevation and depression of the ST segment. The magnitude of ST segment deviation is measured as the height difference (in millimeters) between the J point and the PR segment. Refer to Figure 13 for examples.
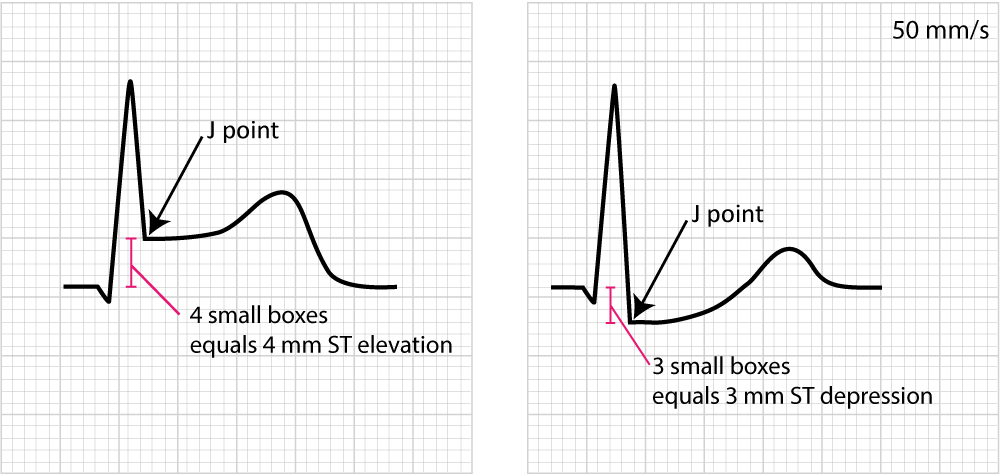
Figure 14 below shows how to measure ST segment deviation.
The following must be noted regarding the ST segment:
- The normal ST segment is flat and isoelectric. The transition from ST segment to T-wave is smooth, and not abrupt.
- ST segment deviation (elevation, depression) is measured as the height difference (in millimeters) between the J point and the baseline (the PR segment). ST segment deviation occurs in a wide range of conditions, particularly acute myocardial ischemia.
- Because the ST segment and the T-wave are electrophysiologically related, changes in the ST segment are frequently accompanied by T-wave changes. The term ST-T segment changes (or simply ST-T changes) is used to refer to such ECG changes.
It must also be noted that the J point is occasionally suboptimal for measuring ST segment deviation. This is explained by the fact that the J point is not always isoelectric; this occurs if there are electrical potential differences in the myocardium by the end of the QRS complex (it typically causes J point depression). The reason for such electrical potential difference is that not all ventricular myocardial cells will finish their action potential simultaneously. Myocardial cells which depolarized at the beginning of the QRS complex will not be in the exact same phase as cells which depolarized during the end of the QRS complex. Due to this it is sometimes recommended that ST segment deviation be measured in the J-60 point, or J-80 point, which is located 60 and 80 milliseconds, respectively, after the J point (Comprehensive Electrocardiology, MacFarlane et al, Springer, 2010; Chou’s Electrocardiologi, Surawicz, Elsevier 2010). At the time of J-60 and J-80, there is minimal chance that there are any electrical potential differences in the myocardium. Current guidelines, however, still recommend the use of the J point for assessing acute ischemia (Third Universal Definition of Myocardial Infarction, Thygesen et al, Circulation). A notable exception to this rule is the exercise stress test, in which the J-60 or J-80 is always used (because exercise frequently causes J point depression).
As mentioned above there are numerous other conditions that affect the ST-T segment and it is fundamental to be able to differentiate these. For this purpose it is wise to subdivide ST-T changes into primary and secondary.
Primary and secondary ST-T changes
Primary ST-T changes are caused by abnormal repolarization. This is seen in ischemia, electrolyte disorders (calcium, potassium), tachycardia, increased sympathetic tone, drug side effects etc.
Secondary ST-T changes occur when abnormal depolarization causes abnormal repolarization. This is seen in bundle branch blocks (left and right bundle branch block), pre-excitation, ventricular hypertrophy, premature ventricular complexes, pacemaker stimulated beats etc. In each of these conditions the depolarization is abnormal and this affects the repolarization so that it cannot be carried out normally.
The next discussion will be devoted to characterize important and common ST-T changes.
ST segment depression
ST segment depression is measured in the J point. The reference point is, as usual, the PR segment. ST segment depression less than 0.5 mm is accepted in all leads. ST segment depression 0.5 mm or more is considered pathological. Some expert consensus documents also note that any ST segment depression in V2–V3 should be considered abnormal (because healthy individuals rarely display depressions in those leads). Please note that every cause of ST segment depression discussed below is illustrated in Figure 15. Study this figure carefully.

Primary ST depressions
Physiological ST segment depressions occur during physical exercise. These ST segment depressions display an upsloping ST segment, typically depressed <1 mm in the J-60 point and the depressions are normalized rapidly after the exercise has ended. Hyperventilation bring about the same ST segment depressions as physical exercise. Figure 15 A.
Digoxin causes generalized ST segment depressions with a curved ST segment (generalized implies that the depression can be seen in most ECG leads). Figure 15 B.
Sympathetic tone and hypokalemia causes ST segment depressions (typically <0.5 mm).
Heart failure may cause ST segment depression in the left lateral leads (V5, V6, aVL and I) and these depressions are generally horizontal or downsloping.
Supraventricular tachycardias also cause ST segment depressions which typically occur in V4–V6 with a horizontal or slightly upsloping ST segment. These ST segment depression should resolve within minutes after termination of the tachycardia.
Ischemic ST depressions display a horizontal or downsloping ST segment (this is a requirement according to North American and European guidelines). The horizontal ST segment depression is most typical of ischemia (Figure 15 C). ST segment depressions with upsloping ST segments are rarely caused by myocardial ischemia. However there is one notable exception, when an upsloping ST segment is actually caused by ischemia and the condition is actually alarming. Upsloping ST segment depressions which are accompanied by prominent T-waves in the majority of the precordial leads may be caused by an acute occlusion of the left anterior descending coronary artery (LAD). This constellation – with upsloping ST depression and prominent T-waves in the precordial leads during chest discomfort – is referred to as de Winters sign (Figure 15 C).
Secondary ST depression
Secondary ST segment depressions occur in the following conditions:
- Left ventricular hypertrophy
- Right ventricular hypertrophy
- Left bundle branch block
- Right bundle branch block
- Pre-excitation
- Pacemaker stimulation in the (right) ventricle
These are all common conditions in which an abnormal depolarization (altered QRS complex) causes abnormalities in the repolarization (altered ST-T segment). For example, a block in the left bundle branch means that the left ventricle will not be depolarized via the Purkinje network, but rather via spread of the depolarization from the right ventricle. The abnormal ventricular depolarization will cause an abnormal repolarization. As evident from Figure 35 (panel D) these conditions are characterized by oppositely directed QRS- and ST-T-segments (recall that this is referred to as discordance). Hence, ECG leads with net positive QRS complexes will show ST segment depressions (as well as T-wave changes).
ECG changes in myocardial ischemia are discussed in section 3 (Acute & Chronic Myocardial Ischemia & Infarction) and a specific chapter discusses ST depression.
ST segment elevation
ST segment elevation is measured in the J-point. In the setting of chest discomfort (or other symptoms suggestive of myocardial ischemia) ST segment elevation is an alarming finding as it indicates that the ischemia is extensive and the risk of malignant arrhythmias is high. However, there are many other causes of ST segment elevations and for obvious reasons one must be able to differentiate these. Figure 16 displays characteristics of ischemic and non-ischemic ST segment elevations. This figure must also be studied in detail.

Ischemia typically causes ST segment elevations with straight or convex ST segments (Figure 16, panel A). The straight ST segment can be either upsloping, horizontal or (rarely) downsloping. Non-ischemic ST segment elevations are typically concave (Figure 16, panel B). Concave ST segment elevations are extremely common in any population; e.g ST segment elevation in leads V2–V3 occur in 70% of all men under the age of 70. There is no definite way to rule out myocardial ischemia by judging the appearance of the ST segment, which is why North American and European guidelines assert that the appearance of the ST segment cannot be used to rule out ischemia. ECG changes in ischemia are discussed in detail in section 3 (Acute & Chronic Myocardial Ischemia & Infarction) and a specific chapter discusses ST elevation in detail.
This article is part of the comprehensive chapter: How to read and interpret the normal ECG

