The QRS complex (ventricular complex): normal and abnormal configurations and intervals
A complete QRS complex consists of a Q-, R- and S-wave. However, all three waves may not be visible and there is always variation between the leads. Some leads may display all waves, whereas others might only display one of the waves. Regardless of which waves are visible, the wave(s) that reflect ventricular depolarization is always referred to as the QRS complex.
Naming of the waves in the QRS complex:
Naming of the waves in the QRS complex is easy but frequently misunderstood. The following rules apply when naming the waves:
- A deflection is only referred to as a wave if it passes the baseline.
- If the first wave is negative then it is referred to as Q-wave. If the first wave is not negative, then the QRS complex does not possess a Q-wave, regardless of the appearance of the QRS complex.
- All positive waves are referred to as R-waves. The first positive wave is simply an “R-wave” (R). The second positive wave is called “R-prime wave” (R’). If a third positive wave occurs (rare) it is referred to as “R-bis wave” (R”).
- Any negative wave occurring after a positive wave is an S-wave.
- Large waves are referred to by their capital letters (Q, R, S), and small waves are referred to by their lower-case letters (q, r, s).
Figure 5 shows examples of naming of the QRS-complex.

Net direction of the QRS complex
The QRS complex can be classified as net positive or net negative, referring to its net direction. The QRS complex is net positive if the sum of the positive areas (above baseline) exceeds that of the negative areas (below baseline). Refer to Figure 6, panel A. These calculations are approximated simply by eyeballing. Panel B in Figure 6 shows a net negative QRS complex, because the negative areas are greater than the positive area.

Electrical vectors that engender the QRS complex
Depolarization of the ventricles generate three large vectors, which explains why the QRS complex is composed of three waves. It is fundamental to understand the genesis of these waves and although it has been discussed previously a brief rehearsal is warranted. Figure 7 illustrates the vectors in the horizontal plane. Study Figure 7 carefully, as it illustrates how the P-wave and QRS complex are generated by the electrical vectors.
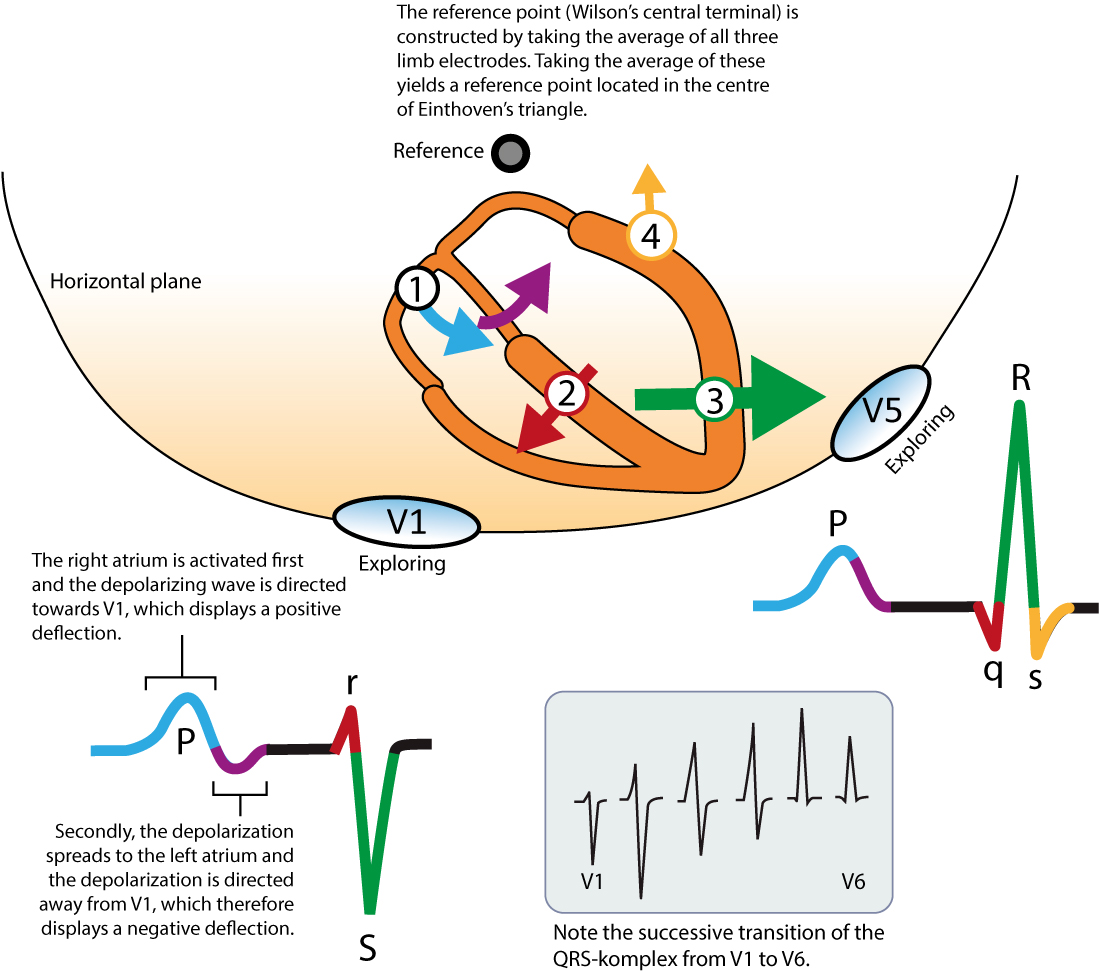
Note that the first vector in Figure 7 is not discussed here as it belongs to atrial activity.
The second vector: the ventricular (interventricular) septum
The ventricular septum receives Purkinje fibers from the left bundle branch and therefore depolarization proceeds from its left side towards its right side. The vector is directed forward and to the right. The ventricular septum is relatively small, which is why V1 displays a small positive wave (r-wave) and V5 displays a small negative wave (q-wave). Thus, it is the same electrical vector that results in an r-wave in V1 and q-wave in V5.
The third vector: the ventricular free wall
The vectors resulting from activation of the ventricular free walls is directed to the left and downwards (Figure 7). The explanation for this is as follows:
- The vector resulting from activation of the right ventricle does not come to expression, because it is drowned by the many times larger vector generated by the left ventricle. Thus, the vector during activation of the ventricular free walls is actually the vector generated by the left ventricle.
- Activation of the ventricular free wall proceeds from the endocadrium to the epicardium. This is because the Purkinje fibers run through the endocardium, where they deliver the action potential to contractile cells. The subsequent spread of the action potential occur from one contractile cell to another, starting in the endocardium and heading towards the epicardium.
As evident from Figure 7, the vector of the ventricular free wall is directed to the left (and downwards). Lead V5 detects a very large vector heading towards it and therefore displays a large R-wave. Lead V1 records the opposite, and therefore displays a large negative wave called S-wave.
The fourth vector: basal parts of the ventricles
The final vector stems from activation of the basal parts of the ventricles. The vector is directed backwards and upwards. It heads away from V5 which records a negative wave (s-wave). Lead V1 does not detect this vector.
Implications and causes of wide (broad) QRS complex
Prolongation of QRS duration implies that ventricular depolarization is slower than normal. The QRS duration is generally <0,10 seconds but must be <0,12 seconds. If QRS duration is ≥ 0,12 seconds (120 milliseconds) then the QRS complex is abnormally wide (broad). This is very common and a significant finding. The reason for wide QRS complexes must always be clarified. Clinicians often perceive this as a difficult task despite the fact that the list of differential diagnoses is rather short. The following causes of wide QRS complexes must be familiar to all clinicians:
- Bundle branch block: The left and the right bundle branch consists of Purkinje fibers which spread out into the ventricular myocardium. The Purkinje network enables fast impulse conduction so that the action potential can be delivered to the whole myocardium at the same time (approximately). Bundle branch block occurs if a bundle branch is dysfunctional and unable to transmit the impulse. The ventricle whose bundle is blocked will have to wait for electrical impulses to spread from the other ventricle. Because spread of the impulse from the other ventricle will take place partly or entirely outside of the conduction system, it will be slow and therefore the QRS duration is prolonged. Left and right bundle branch block are discussed in separate articles.
- Hyperkalemia: Hyperkalemia causes slow impulse transmission (in all myocardial and conduction cells) and prolongation of the QRS duration.
- Drugs: class I antiarrhythmic drugs, tricyclic antidepressants and other medications can cause widening of the QRS complex.
- Ventricular rhythm, ventricular ectopy and pacemaker with ventricular stimulation:
- Spontaneous action potentials discharged within the ventricles may depolarize the ventricles. The cell/structure which discharges the action potential is referred to as an ectopic focus. Such a focus may fire a single or multiple impulses (either consecutively or intermittently). A single impulse gives rise to a premature ventricular beat, whereas multiple impulses may establish a ventricular rhythm, or even ventricular tachycardia. In all these instances the QRS complex will be broad because the depolarizing impulse arises and spreads outside of the normal conduction system.
- External (artificial) pacemakers have an electrode inserted in the right ventricular apex. Electrical stimulation in the right ventricular apex will give rise to an action potential propagating from there, i.e partly or entirely outside of the conduction system (which will cause wide QRS complexes).
- Pre-excitation (Wolff-Parkinson-White syndrome): Pre-excitation implies the existence of an accessory pathway (in addition to the atrioventricular node) between the atria and the ventricles. Such pathways virtually always insert into the ventricular myocardium, from where the action potential spreads. Again, the spread takes place outside of the conduction system which is slow and causes widening of the QRS complex.
- Aberrant ventricular conduction (aberrancy): Aberrant conduction is actually a bundle branch block which occurs when the length of the cardiac cycle is rapidly changed, particularly at high heart rates. The bundle branches (particularly the right bundle branch) may occasionally fail to adapt their repolarization period to the length of the cardiac cycle (which they also do). This is discussed in detail in the article on aberrant ventricular conduction.
Figure 8 (below) shows examples of normal and abnormally wide QRS complexes at 25 mm/s and 50 mm/s paper speed.

Amplitude of the QRS complex
A QRS complex with large amplitudes may be explained by ventricular hypertrophy or enlargement (or a combination of both). The electrical currents generated by the ventricular myocardium are proportional to the ventricular muscle mass. Hypertrophy means that there is more muscle and hence larger electrical potentials generated. However, the distance between the heart and the electrodes may have a significant impact on amplitudes of the QRS complex. For example, slender individuals generally have a shorter distance between the heart and the electrodes, as compared with obese individuals. Therefore, the slender individual may present with much larger QRS amplitudes. Similarly, a person with chronic obstructive pulmonary disease often display diminished QRS amplitudes due to hyperinflation of thorax (increased distance to electrodes). Low amplitudes may also be caused by hypothyreosis. In the setting of circulatory collapse, low amplitudes should raise suspicion of cardiac tamponade.
R-wave amplitude
It is important to assess the amplitude of the R-waves. High amplitudes may be due to ventricular enlargement or hypertrophy. To determine whether the amplitudes are enlarged, the following references are at hand:
- R-wave should be < 26 mm in V5 and V6.
- R-wave amplitude in V5 + S-wave amplitude in V1 should be <35 mm.
- R-wave amplitude in V6 + S-wave amplitude in V1 should be <35 mm.
- R-wave amplitude in aVL should be ≤ 12 mm.
- R-wave amplitude in leads I, II and III should all be ≤ 20 mm.
- If R-wave in V1 is larger than S-wave in V1, the R-wave should be <5 mm.
(1 mm corresponds to 0.1 mV on standard ECG grid).
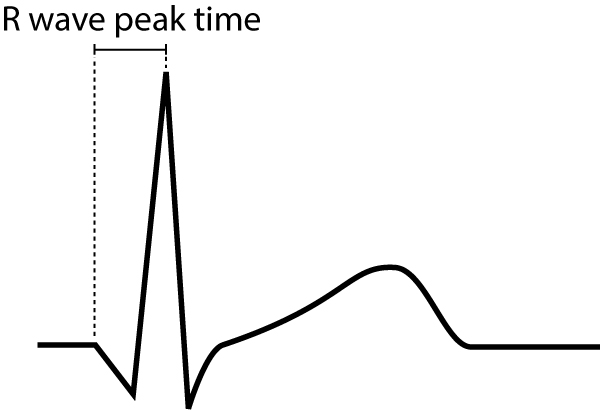
R-wave peak time
R-wave peak time (Figure 9) is the interval from the beginning of the QRS-complex to the apex of the R-wave. This interval reflects the time elapsed for the depolarization to spread from the endocardium to the epicardium. R-wave peak time is prolonged in hypertrophy and conduction disturbances.
Normal values for R-wave peak time follow:
- Leads V1-V2 (right ventricle) <0,035 seconds
- Leads V5-V6 (left ventricle) <0,045 seconds
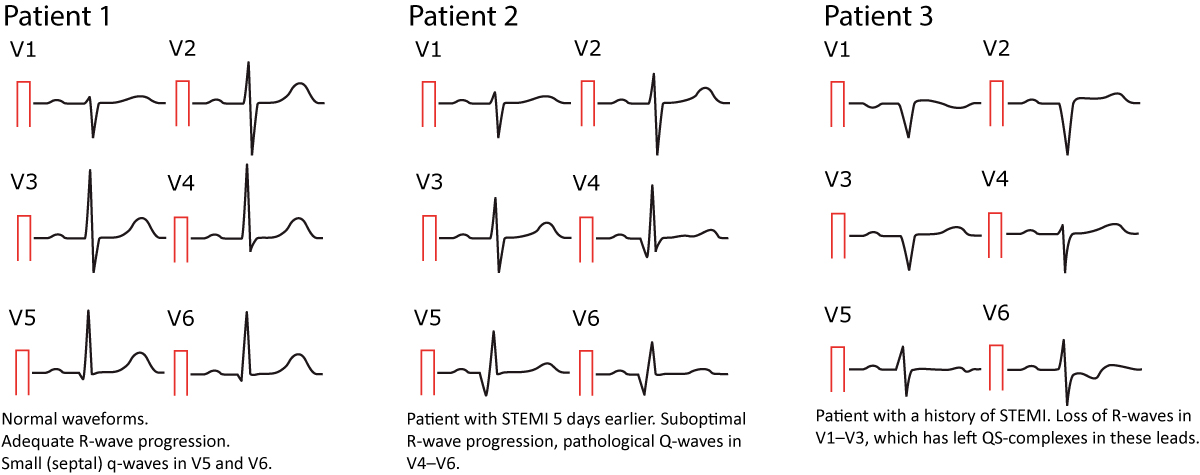
R-wave progression
R-wave progression is assessed in the chest (precordial) leads. Normal R-wave progression implies that the R-wave gradually increases in amplitude from V1 to V5 and then diminishes in amplitude from V5 to V6 (Figure 10, left hand side). The S-wave undergoes the opposite development. Abnormal R-wave progression is a common finding which may be explained by any of the following conditions:
- Myocardial infarction: necrotic myocardium does not generate electrical potentials and therefore there is a loss of R-wave amplitude in the ECG leads reflecting the necrotic area (Figure 10, right hand side).
- Cardiomyopathy may cause either loss or gain of R-wave amplitude, depending on the type of cardiomyopathy. Amplitudes may be increased in hypertrophic cardiomyopathy, whereas they are typically diminished in late stages of dilated cardiomyopathy.
- Right and left ventricular hypertrophy also amplifies the R-wave amplitude. Left ventricular hypertrophy causes increased R-wave amplitudes in V4–V6 and deeper S-waves in V1–V3. Right ventricular hypertrophy causes large R-waves in V1–V3 and smaller R-waves in V4–V6.
- Pre-excitation, bundle branch block and chronic obstructive pulmonary disease (COPD) may also affect R-wave progression. These conditions are discussed in detail later on.
Note that the R-wave is occassionally missing in V1 (may be due to misplacement of the electrode). This is considered a normal finding provided that an R-wave is seen in V2.

Dominant R-wave in V1/V2
As seen in Figure 10 (left hand side) the R-wave in V1–V2 is considerably smaller than the S-wave in V1–V2. Dominant R-wave in V1/V2 implies that the R-wave is larger than the S-wave, and this may be pathological. If the R-wave is larger than the S-wave, the R-wave should be <5 mm, otherwise the R-wave is abnormally large. This may be explained by right bundle branch block, right ventricular hypertrophy, hypertrophic cardiomyopathy, posterolateral ischemia/infarction (if the patient experiences chest pain), pre-excitation, dextrocardia or misplacement of chest electrodes.
The Q-wave
It is crucial to differentiate normal from pathological Q-waves, particularly because pathological Q-waves are rather firm evidence of previous myocardial infarction. However, there are numerous other causes of Q-waves, both normal and pathological and it is important to differentiate these.
The amplitude (depth) and the duration (width) of the Q-wave dictates whether it is abnormal or not. Pathological Q-waves have duration ≥0,03 sec and/or amplitude ≥25% of the R-wave amplitude. Pathological Q-waves must exist in at least two anatomically contiguous leads (i.e neighbouring leads, such as aVF and III, or V4 and V5) in order to reflect an actual morphological abnormality. The existence of pathological Q-waves in two contiguous leads is sufficient for a diagnosis of Q-wave infarction. This is illustrated in Figure 11.

Normal variants of Q-waves
Septal q-waves are small q-waves frequently seen in the lateral leads (V5, V6, aVL, I). They are due to the normal depolarization of the ventricular septum (see previous discussion). Two small septal q-waves can actually be seen in V5–V6 in Figure 10 (left hand side).
An isolated and often large Q-wave is occasionally seen in lead III. The amplitude of this Q-wave typically varies with ventilation and it is therefore referred to as a respiratory Q-wave. Note that the Q-wave must be isolated to lead III (i.e the neighbouring lead, which is aVF, must not display a pathological Q-wave).
As noted above, the small r-wave in V1 is occasionally missing, which leaves a QS-complex in V1 (a QRS complex consisting of only a Q-wave is referred to as a QS-complex). This is considered a normal finding provided that lead V2 shows an r-wave. If the R-wave is missing in lead V2 as well, then criteria for pathology is fulfilled (two QS-complexes).
Small Q-waves (which do not fulfill criteria for pathology) may be seen in all limb leads as well as V4–V6. If these Q-waves do not fulfill criteria for pathology, then they should be accepted. Leads V1–V3, on the other hand, should never display Q-waves (regardless of their size).
Abnormal (pathological) Q-waves
The most common cause of pathological Q-waves is myocardial infarction. If myocardial infarction leaves pathological Q-waves, it is referred to as Q-wave infarction. Criteria for such Q-waves are presented in Figure 11. Note that pathological Q-waves must exist in two anatomically contiguous leads.
Other causes of abnormal Q-waves are as follows:
- Left-sided pneumothorax
- Dectrocadia
- Perimyocarditis
- Cardiomyopathy
- Amyloidosis
- Bundle branch blocks, fascicular blocks
- Pre-excitation (WPW syndrome)
- Ventricular hypertrophy
- Acute cor pulmonale
To differentiate these causes of abnormal Q-waves from Q-wave infarction, the following can be advised:
- If it is unlikely that the patient has coronary heart disease, other causes are more likely. It should be noted, however, that up to 20% of Q-wave infarctions may develop without symptoms (The Framingham Heart Study).
- If coronary heart disease is likely, then infarction is the most probable cause of the Q-waves.
- The longer the Q-wave duration, the more likely that infarction is the cause of the Q-waves. Infarction Q-waves are typically >40 ms.
Examples of normal and pathological Q-waves (after acute myocardial infarction) are presented in Figure 12 below.
This article is part of the comprehensive chapter: How to read and interpret the normal ECG

