Video lecture: The ECG curve: P-wave, PR Interval, Q-wave, R-wave, S-wave, QRS complex, ST segment, T-wave and QT interval

You are not logged in. Please log in to view all video lectures, all chapters in the ECG book, ECG tests and much more. Log in or Register.
Summary of lecture
The Normal ECG (EKG) waves, intervals, durations and rhythm
ECG interpretation requires firm knowledge of the characteristics of the normal ECG. The waves, intervals, durations and assessment of rhythm is fundamental to ECG interpretation. Below follows a brief summary of the ECG waves, their appearance, terminology, physiological background and interpretation.
Overview of the normal electrocardiogram (ECG / EKG)
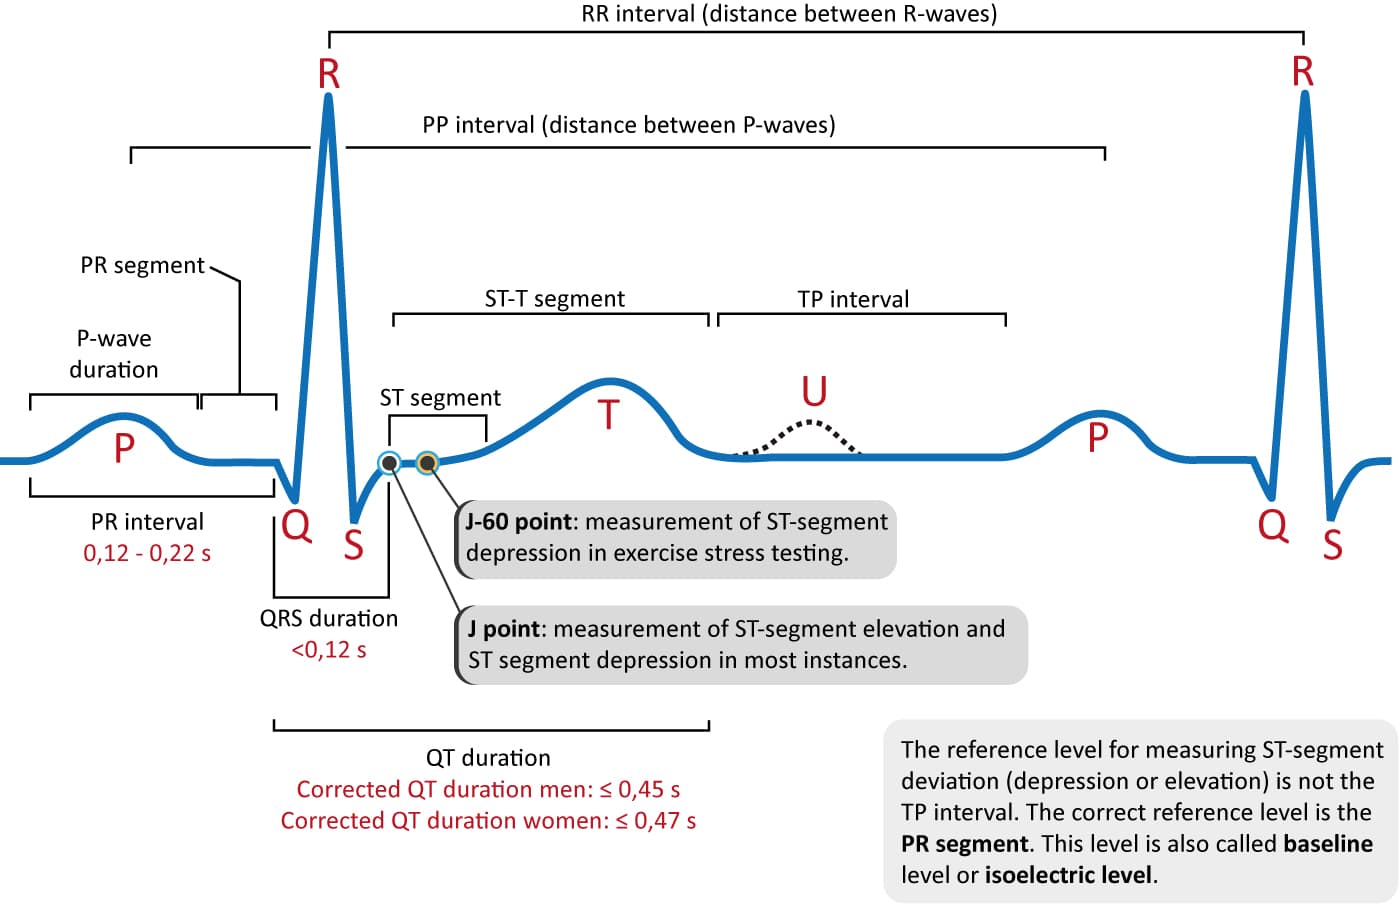
Figure 1. The classical ECG curve with its most common waveforms. Important intervals and points of measurement are depicted. ECG interpretation requires knowledge of these waves and intervals.
The P-wave, PR interval and PR segment
ECG interpretation starts with assessment of the P-wave and PR interval. The P-wave is generated by depolarization (activation, contraction) of the atria. The PR interval is the interval between the start of the P-wave and the start of the QRS complex. The PR interval determines whether impulse transmission from atria to ventricles is normal. The isoelectric (flat) line between the end of the P-wave and the start of the QRS complex is called the PR segment. The PR segment is the baseline (also referred to as reference line or isoelectric line) of the ECG curve. Thus, when measuring the amplitude of a wave on the ECG, the PR segment is the baseline. Refer to Figure 1.
The QRS complex
The QRS complex reflects the depolarization (activation, contraction) of the ventricles. Although it may not always include a Q-wave, R-wave and S-wave, it is still referred to as a QRS complex. In other words, if ventricular depolarization only generates a Q-wave and an R-wave, that complex may still be referred to as a QRS complex. However, one may also be more explicit and refer to such a complex as a QR complex. Because the left ventricle is usually considerably larger than the right ventricle, the QRS complex is actually a reflection of the electrical potentials generated by the left ventricle.
QRS duration
QRS duration is the time duration from the start to the end of the QRS complex. A short QRS complex implies that the ventricles are depolarized rapidly, which in turn implies that the electrical conduction system functions normally. Wide (also referred to as broad) QRS complexes indicate that ventricular depolarization is slow, which may be a consequence of disturbances in the electrical conduction system.
The J point and the ST segment
The ST segment must always be studied carefully since its appearance may be changed in a wide range of serious conditions. The ST segment is of special interest in the setting of acute myocardial ischemia. This is explained by the fact that ongoing ischemia causes deviation (shift) of the ST segment (ST segment deviation). ST segment depression implies that the ST segment is depressed below the level of the PR segment. ST segment elevation implies that the ST segment is elevated above the level of the PR segment. The magnitude of any ST segment deviation is measured as the height difference (millimeters) between the J point and the PR segment. The J point is where the ST segment starts.
The T-wave
The T-wave reflects the rapid repolarization (recovery) of the myocardium and T-wave changes occur in numerous conditions. T-wave changes are frequently misunderstood. The transition from the ST segment to the T-wave should be smooth. The normal T-wave is somewhat asymmetric, with a steeper downward slope.
The U-wave
The U-wave, which is a positive wave after the T-wave, appears occasionally on the ECG. Its height (amplitude) is approximately one fourth of the amplitude of the T-wave. The U-wave is most often seen in leads V2, V3 and V4. Individuals with prominent T-waves display U-waves more often. Moreover, the U-wave is clearer during slow heart rates (bradycardia). The physiological process that generates the U-wave remain elusive.
QT duration and QTc duration (corrected QT duratation)
QT duration reflects the total duration of ventricular depolarization (activation) and repolarization (recovery). It is measured from the start of the QRS complex to the end of the T-wave. The QT interval increases at slower heart rates and vice versa (i.e it decreases at higher heart rates). Therefore, to judge whether the QT interval is normal it is necessary to take the heart rate into account. The heart rate adjusted QT interval is the corrected QT interval, or simply the QTc interval. A long QTc interval causes electrical instability in the ventricles and this may cause lethal ventricular arrhythmias.
