Physiology and ECG features of the P-wave, PR interval and PR segment
The P-wave
ECG interpretation usually starts with assessment of the P-wave. The P-wave is a small, positive and smooth wave. It is small because the atria make a relatively small muscle mass. If the rhythm is sinus rhythm (i.e under normal circumstances) the P-wave vector is directed downwards and to the left in the frontal plane and this yields a positive P-wave in lead II (Figure 2, right hand side). The P-wave is always positive in lead II during sinus rhythm. This is rather easy to understand because lead II is angled alongside the P-wave vector, and the exploring electrode is located in front of the P-wave vector (Figure 2, right hand side).
This article is part of the comprehensive chapter: How to interpret the ECG
The P-wave vector is slightly curved in the horizontal plane. It is initially directed forward but then turns left to activate the left atrium (Figure 2, left hand side). Lead V1 might therefore display a biphasic (diphasic) P-wave, meaning that the greater portion of the P-wave is positive but the terminal portion is slightly negative (the vector generated by left atrial activation heads away from V1). Occasionally, the negative deflection is also seen in lead V2. lead V5 only notes vectors heading towards the exploring electrode (albeit with somewhat varying angles) and therefore displays a positive P-wave throughout.

Figure 2 (above) does not show that the P-wave in lead II might actually be slightly asymmetric by having two humps. This is often (but not always) seen on ordinary ECG tracings and it is explained by the fact that the atria are depolarized sequentially, with the right atrium being depolarized before the left atrium. The first half of the P-wave is therefore a reflection of right atrial depolarization and the second half is a reflection of left atrial depolarization. This is shown in Figure 3 (upper panel). Recall that the P-wave in V1 is often biphasic, which is also shown in Figure 3.
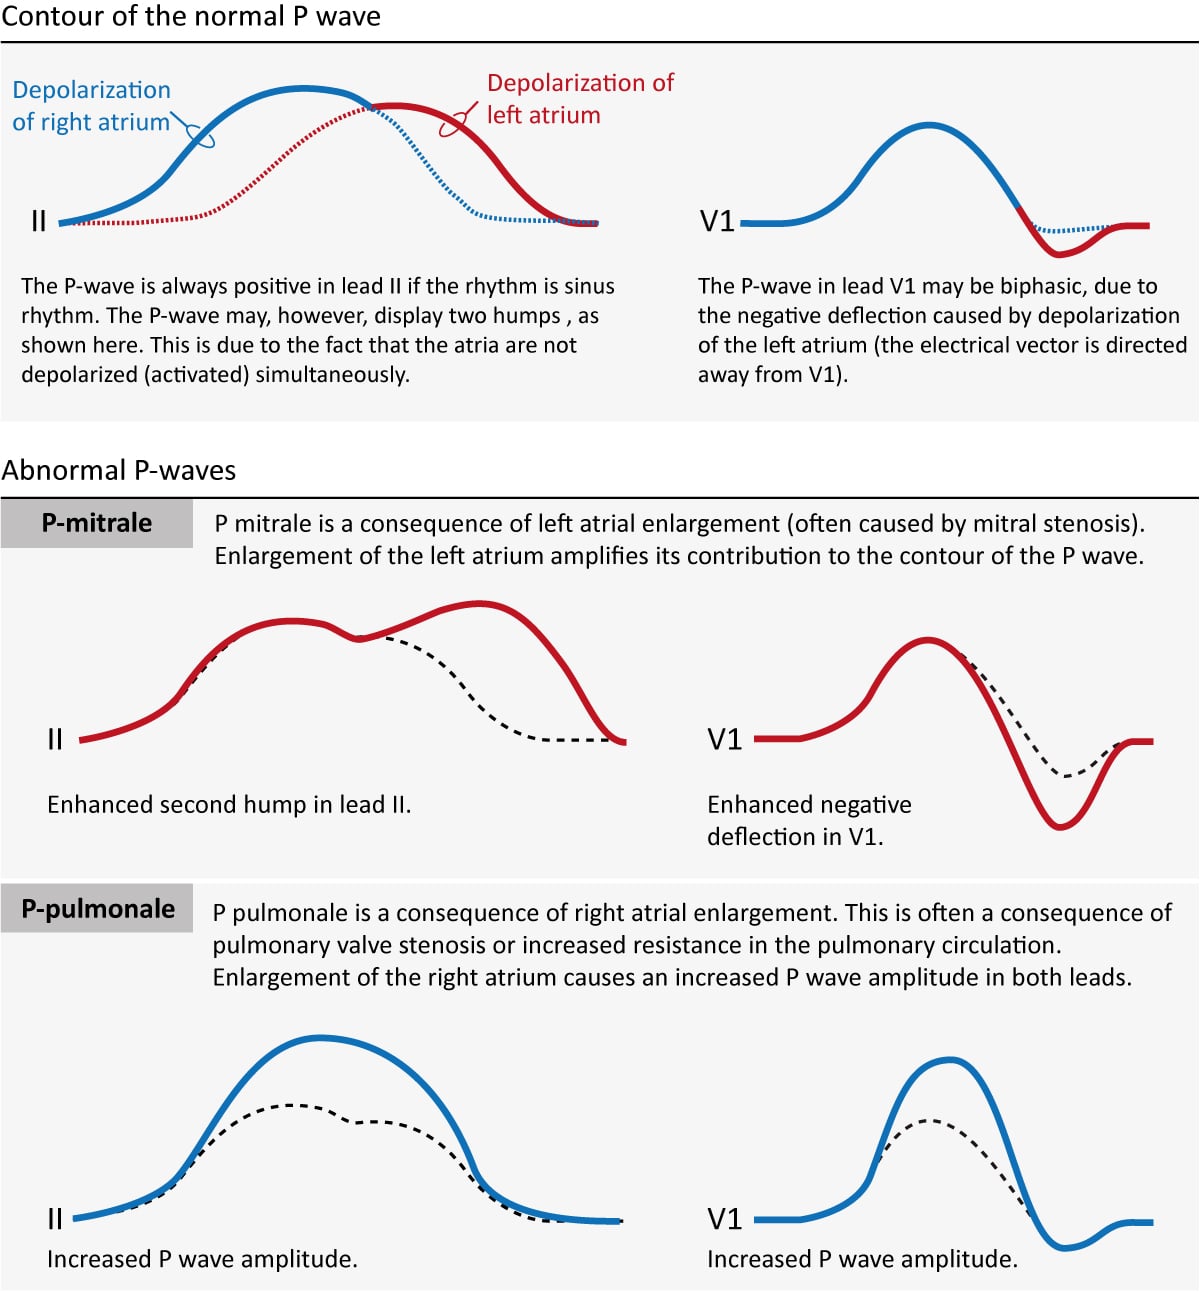
If an atria becomes enlarged (typically as a compensatory mechanism) its contribution to the P-wave will be enhanced. Enlargement of the left and right atria causes typical P-wave changes in lead II and lead V1 (Figure 3).
Enlargement of the right atrium is commonly a consequence of increased resistance to empty blood into the right ventricle. This may be due to pulmonary valve stenosis, increased pulmonary artery pressure etc. The right atrium must then enlarge (hypertrophy) in order to manage to pump blood into the right ventricle. Right atrial enlargement (hypertrophy) leads to stronger electrical currents and thus enhancement of the contribution of the right atrium to the P-wave. The P-wave will display higher amplitude in lead II and lead V1. Such a P-wave is called P pulmonale because pulmonary disease is the most common cause (Figure 3, P-pulmonale).
If the left atrium encounters increased resistance (e.g due to mitral valve stenosis) it becomes enlarged (hypertrophy) which amplifies its contribution to the P-wave. The second hump in lead II becomes larger and the negative deflection in V1 becomes deeper. This is called P mitrale, because mitral valve disease is a common cause (Figure 25, P-mitrale).
If the atria are depolarized by impulses generated by cells outside of the sinoatrial node (i.e by an ectopic focus), the morphology of the P-wave may differ from the P-waves in sinus rhythm. If the ectopic focus is located close to the sinoatrial node, the P-wave will have a morphology similar to the P-wave in sinus rhythm. However, an ectopic focus may be located anywhere. If it is located near the atrioventricular node, activation of the atria will proceed in the opposite direction, which produces an inverted (retrograde) P-wave.
P-wave checklist
- The P-wave is always positive in lead II during sinus rhythm.
- The P-wave is virtually always positive in leads aVL, aVF, –aVR, I, V4, V5 and V6. It is negative in lead aVR.
- The P-wave is frequently biphasic in V1 (occasionally in V2). The negative deflection is normally <1 mm.
- P-wave duration should be ≤0,12 seconds.
- P-wave amplitude should be <2,5 mm in the limb leads.
- P-pulmonale implies that the P-wave has abnormally high amplitude in lead II (and in other leads in general).
- P-mitrale implies that the second hump of the P-wave in lead II and the negative deflection of the P-wave in lead V1 are both enhanced.
PR interval and PR segment
The PR interval starts at the onset of the P-wave and ends at the onset of the QRS complex (Figure 1). It reflects the time interval from start of atrial depolarization to start of ventricular depolarization. The PR interval is assessed in order to determine whether impulse conduction from the atria to the ventricles is normal in terms of speed. The PR interval must not be too long nor too short. A normal PR interval ranges between 0.12 seconds to 0.22 seconds.
The flat line between the end of the P-wave and the onset of the QRS complex is called the PR segment and it reflects the slow impulse conduction through the atrioventricular node. The PR segment serves as the baseline (also referred to as reference line or isoelectric line) of the ECG curve. The amplitude of any deflection/wave is measured by using the PR segment as the baseline.
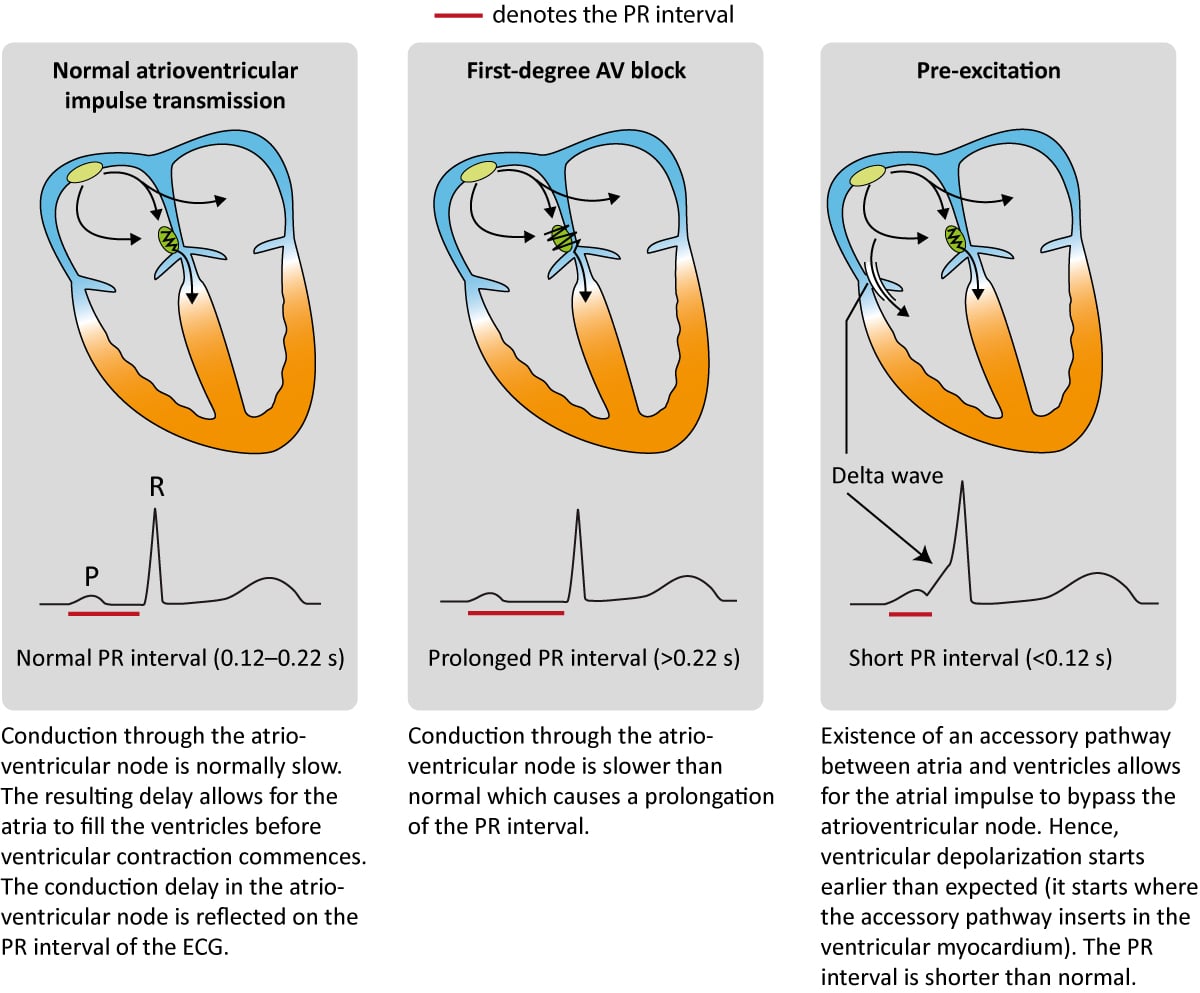
Numerous conditions can diminish the capacity of the atrioventricular node to conduct the atrial impulse to the ventricles. As the conduction diminishes, the PR interval becomes longer. When the PR interval exceeds 0.22 seconds, first-degree AV-block is manifest. The term block is somewhat misleading since it is actually a matter of abnormal delay and not a block per se. The most common cause of first-degree AV-block is degenerative (age-related) fibrosis in the conduction system. Myocardial ischemia/infarction and medications (e.g beta-blockers) may also cause first-degree AV-block. Note that the upper reference limit (0.22 seconds) should be related to the age of the patient; 0.20 seconds is more suitable for young adults because they have a faster impulse conduction. Refer to Figure 4 (second panel). AV-blocks are discussed in detail later.
The atrioventricular (AV) node is normally the only connection between the atria and the ventricles. The atria and the ventricles are electrically isolated from each other by the fibrous rings (anulus fibrosus). However, it is not rare to have an additional – accessory – pathway between the atria and the ventricles. Such an accessory pathway is an embryological remnant which may be located almost anywhere between the atria and the ventricles. It enables the atrial impulse to pass directly to the ventricles and start ventricular depolarization prematurely. If the atrial impulse uses an accessory pathway, the impulse delay in the atrioventricular node is bypassed and therefore the PR interval becomes shortened (PR interval <0.12 seconds). The condition is referred to as pre-excitation, because the ventricles are excited prematurely. This is illustrated in Figure 4 (third panel). As seen in Figure 4 (third panel) the initial depolarization of the ventricles (starting where the accessory pathway inserts into the ventricular myocardium) is slow because the impulse will not spread via the normal His-Purkinje pathway. The slow initial depolarization is seen as a delta wave on the ECG (Figure 4, third panel). However, apart from the delta wave, the R-wave will appear normal because ventricular depolarization will be executed normally as soon as the atrioventricular node delivers the impulse to the His-Purkinje system.
PR interval checklist
- Normal PR interval: 0,12–0,22 seconds. Upper reference limit is 0,20 seconds in young adults.
- A prolonged PR interval (>0.22 s) is consistent with first-degree AV-block.
- A shortened PR interval (<0,12 s) indicates pre-excitation (presence of an accessory pathway). This is associated with a delta wave.
This article is part of the comprehensive chapter: How to read and interpret the normal ECG

