
Left bundle branch block (LBBB): ECG criteria, causes, management
Left bundle branch block (LBBB): ECG criteria and clinical implications
Left bundle branch block (LBBB) is the consequence of anatomical or functional dysfunction in the left bundle branch, causing the impulse to be blocked. Depolarization of the left ventricle will be carried out by impulses spreading from the right ventricle. Because the left bundle branch is dysfunctional, the impulse will spread (through the left ventricle) partly or entirely outside of the conduction system; such impulse conduction is slow and therefore the QRS duration becomes prolonged. The hallmark of left bundle branch block (LBBB) is QRS duration ≥0,12 seconds, deep and broad S-wave in V1/V2 and broad clumsy R-wave in V5/V6. Refer to Figure 1, where the difference between normal conduction, right bundle branch block (RBBB) and left bundle branch block (LBBB) is illustrated.

ECG criteria for left bundle branch block (LBBB)
It is easy to diagnose left bundle branch block (LBBB). The hallmark of LBBB is the prolonged QRS duration. A QRS duration of 120 ms (0.12 s) or more is required to diagnose a complete left bundle branch block. In addition to prolonged QRS duration, LBBB is characterized by deep and broad S-waves in leads V1 and V2 and the broad clumsy R-waves in V5 and V6. ST-T changes always occur in the presence of LBBB. The following ECG criteria are commonly used to diagnose LBBB:
- QRS duration ≥0,12 seconds.
- Leads V1-V2: deep and broad S-wave. The small r-wave is missing or smaller than normal. If it is missing, a QS complex appears in V1 and occasionally V2, but rarely V3. The S-wave in V1 may be notched and resemble the letter “W”.
- Leads V5-V6: Broad, clumsy, completely positive and often notched R-wave.
- Leads I and aVL: Similar to V5 and V6.
- ST-T changes: Left sided leads (V5, V6, I and aVL) shows T-wave inversions and ST segment depressions. V1–V3 shows ST-segment elevation and positive T-waves. The ST-segment elevation rarely exceeds 5 mm.
Figure 2 illustrates left bundle branch block at two paper speeds (25 mm/s and 50 mm/s).
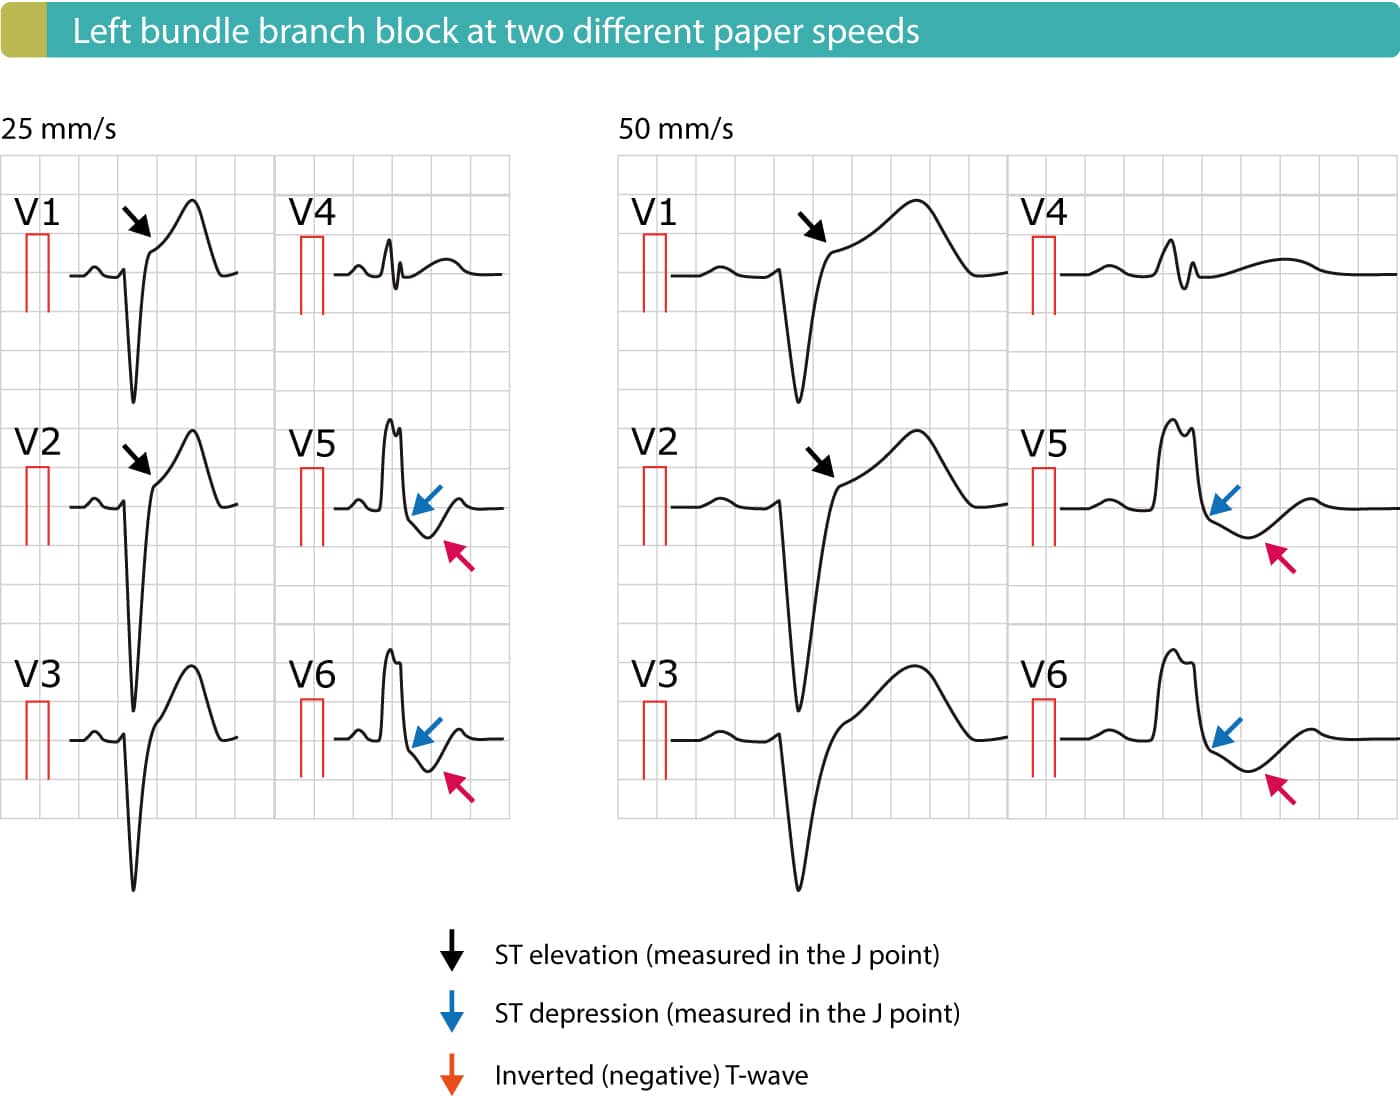
Figure 3 compares the characteristic ECG patterns in leads V1/V2 and leads V5/V6 in the presence of left bundle branch block (LBBB) and right bundle branch block (RBBB).
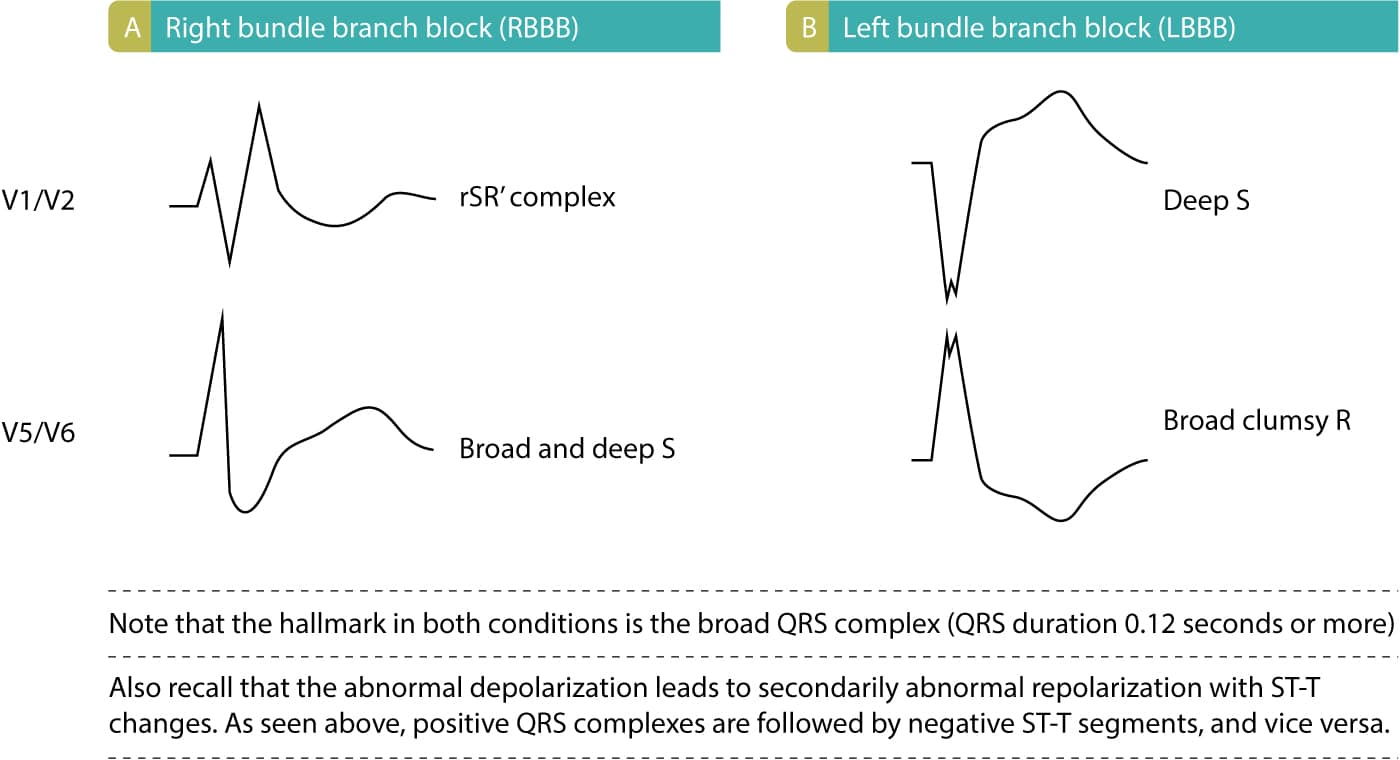
Figure 4 displays how QRS duration can be calculated rapidly on 25 mm/s and 50 mm/s paper speed.

Electrophysiology of left bundle branch block (LBBB)
Ventricular depolarization normally starts in the interventricular septum, which obtains Purkinje fibers from the left bundle branch. Thus depolarization of the septum starts in its left aspects and heads towards its right aspect (refer to Chapter 1). Depolarization of septum yields the small r-waves seen in V1 and V2, and the small q-waves seen in V5 and V6 (“septal q-waves”). In left bundle branch block, depolarization of septum instead occurs via impulses spreading from the right ventricle. Thus, the small r-wave in V1–V2 and small q-wave in V5–V6 is either diminished or disappears. Depolarization continues (slowly) towards the left ventricular free wall, and the vector is continuosly directed leftward. This causes a wide S-wave in V1–V2 (it is referred to as QS complex if the r-wave is absent) and broad and clumsy R-wave in V5–V6. The R-wave may be notched at the apex.
Since left ventricular depolarization is abnormal, the repolarization will also be abnormal and secondary ST-T changes are always present. In left bundle branch block it is expected that ST segment depressions and T-wave inversions exist in left sided leads (V5, V6, I and aVL). Simultaneously, V1–V3 should display ST segment elevation and large R-waves.

The electrical axis may be unaltered or deviate to the left or (rarely) to the right. Left axis deviation suggests a pronounced left bundle branch block.
Clinical implications of left bundle branch block (LBBB)
Left bundle branch block is always pathological. It affects left ventricular contractility and pumping function. Consequently, left bundle branch block confers adverse cardiovascular outcomes. Left bundle branch block is associated with hypertension, ventricular hypertrophy, valvular heart disease, myocarditis, ischemic heart disease, heart failure and cardiomyopathies. The Framingham Heart Study showed that acquired left bundle branch block was associated with seven times as great a risk of heart failure, two times as great a risk of coronary artery disease and significantly higher risk of developing right ventricular hypertrophy. Left bundle branch block is rare in young individuals and appears to affect their prognosis little.
Diagnosis of acute ischemia and infarction in the setting of left bundle branch block (LBBB)
LBBB is due to a dysfunctional left bundle branch. In that scenario, activation of the left ventricle will depend on electrical impulses spreading from the right ventricle. This allows the left ventricle to be depolarized (activated), albeit in a slow and abnormal manner. The abnormal depolarization results in an abnormal QRS complex (discussed above). Abnormal repolarization results in secondary ST-T changes, including ST elevations (leads V1–V3), ST depressions (leads V4, V5, V6, aVL, I) and inverted T-waves (seen in leads with ST depressions). Such ST-T changes are always normal (expected) in the presence of LBBB. Please refer to Figures 1, 2 & 3 for examples.
There are three reasons why LBBB complicates ECG diagnosis of acute myocardial infarction:
- LBBB may imitate acute STEMI – ST elevations, ST depressions and T-wave inversions are also typical of acute STEMI, which is why clinicians often confuse LBBB and acute STEMI. Studies actually demonstrate that LBBB is the most common cause of false catheterization laboratory activation.
- LBBB may mask (conceal) ongoing ischemia – LBBB causes severe disturbance of ventricular repolarization, which usually prevents other ST-T changes (such as those arising from ischemia) to come to expression on ECG. Therefore, ischemic ST-T changes (ST elevations, ST depressions, T-wave changes) are typically concealed in the setting of LBBB. A patient with acute STEMI may therefore display a normal LBBB pattern.
- LBBB may be caused by ischemia/infarction – There are numerous causes of LBBB, such as heart failure, structural heart disease, fibrosis of the conduction system and acute myocardial infarction (particularly anterior STEMI). Hence, an acute myoardial infarction may actually result in LBBB which then masks the ischemic ST-T changes on ECG.
In summary, LBBB may be caused by ischemia/infarction and it may both mask or imitate ischemia/infarction. For this reason, current guidelines recommend that patients with a clinical suspicion of ongoing myocardial ischemia and LBBB should be managed in a way similar to acute STEMI (ST Elevation Myocardial Infarction).
Sgarbossa criteria for diagnosis of acute STEMI in the setting of left bundle branch block (LBBB)
Researchers have strived to identify ECG criteria for diagnosis of acute STEMI in the setting of LBBB. The most useful and validated criteria were developed by Elena Sgarbossa and associates. The Sgarbossa criteria are discussed in detail in LBBB and Sgarbossa Criteria in Acute Myocardial Infarction.
Left ventricular hypertrophy and left bundle branch block
Left ventricular hypertrophy is characterized by increased left ventricular mass. The increased muscle mass may lead to prolonged de- and repolarization, and thus slightly increased QRS duration, but not 0.12 seconds or longer. Moreover, the QRS morphology in left ventricular hypertrophy may also resemble that of left bundle branch block (particularly incomplete left bundle branch block). However, it is usually easy to separate the two. In hypertrophy, the septal q-waves (V5, v6, aVL and I) are preserved (or even amplified), the QRS complex has very large amplitude. In left bundle branch block, the QRS duration is at least 0.12 seconds. Of course, these conditions may accompany each other.
Incomplete left bundle branch block (LBBB)
Incomplete left bundle branch block is less common than the complete variant. Conduction is preserved in the left bundle branch, but it is diminished as compared to a normal bundle branch. Thus, the initial depolarization of the left ventricle occurs via impulses spreading from the right ventricle, but after a while the impulse passes the block in the left bundle branch and executes the remained of ventricular depolarization normally. Hence, the initial QRS complex resembles left bundle branch block but QRS duration is <0.12 seconds. Incomplete left bundle branch blocks tend to progress to complete bundle branch blocks.
- QRS duration >0,10 but < 0,12 seconds.
- R-wave peak time ≥0,06 seconds in i V5, V6.
- Absence of normal septal q-wave in V5, V6, I and aVL.
- Notched ascending limb of R-wave in V5, V6, aVL and I.
 Next chapter
 Next chapter
 Related chapters
 Related chapters
Overview of Intraventricular Conduction Defects
Right bundle branch block (RBBB)
Nonspecific intraventricular conduction delay
View all chapters in Supraventricular and Intraventricular Conduction Defects
