Clinical ECG Interpretation
-
Introduction to ECG Interpretation6 Chapters
-
Cardiac electrophysiology and ECG interpretation
-
Cardiac electrophysiology: Action potential, automaticity and vectors
-
The ECG leads: Electrodes, limb leads, chest (precordial) leads and the 12-Lead ECG
-
The Cabrera format of the 12-lead ECG & lead –aVR instead of aVR
-
ECG interpretation: Characteristics of the normal ECG (P-wave, QRS complex, ST segment, T-wave)
-
How to interpret the ECG: A systematic approach
-
Cardiac electrophysiology and ECG interpretation
-
Arrhythmias and arrhythmology24 Chapters
-
Mechanisms of cardiac arrhythmias: from automaticity to re-entry (reentry)
-
Aberrant ventricular conduction (aberrancy, aberration)
-
Premature ventricular contractions (premature ventricular complex, premature ventricular beats)
-
Premature atrial contraction (premature atrial beat / complex): ECG & clinical implications
-
Sinus rhythm: physiology, ECG criteria & clinical implications
-
Sinus arrhythmia (respiratory sinus arrhythmia)
-
Sinus bradycardia: definitions, ECG, causes and management
-
Chronotropic incompetence (inability to increase heart rate)
-
Sinoatrial arrest & sinoatrial pause (sinus pause / arrest)
-
Sinoatrial block (SA block): ECG criteria, causes and clinical features
-
Sinus node dysfunction (SND) and sick sinus syndrome (SSS)
-
Sinus tachycardia & Inappropriate sinus tachycardia
-
Atrial fibrillation: ECG, classification, causes, risk factors & management
-
Atrial flutter: classification, causes, ECG diagnosis & management
-
Ectopic atrial rhythm (EAT), atrial tachycardia (AT) & multifocal atrial tachycardia (MAT)
-
Atrioventricular nodal reentry tachycardia (AVNRT): ECG features & management
-
Pre-excitation, Atrioventricular Reentrant (Reentry) Tachycardia (AVRT), Wolff-Parkinson-White (WPW) syndrome
-
Junctional rhythm (escape rhythm) and junctional tachycardia
-
Ventricular rhythm and accelerated ventricular rhythm (idioventricular rhythm)
-
Ventricular tachycardia (VT): ECG criteria, causes, classification, treatment
-
Long QT (QTc) interval, long QT syndrome (LQTS) & torsades de pointes
-
Ventricular fibrillation, pulseless electrical activity and sudden cardiac arrest
-
Pacemaker mediated tachycardia (PMT): ECG and management
-
Diagnosis and management of narrow and wide complex tachycardia
-
Mechanisms of cardiac arrhythmias: from automaticity to re-entry (reentry)
-
Myocardial Ischemia & Infarction22 Chapters
-
Introduction to Coronary Artery Disease (Ischemic Heart Disease) & Use of ECG
-
Classification of Acute Coronary Syndromes (ACS) & Acute Myocardial Infarction (AMI)
-
Clinical application of ECG in chest pain & acute myocardial infarction
-
Diagnostic Criteria for Acute Myocardial Infarction: Cardiac troponins, ECG & Symptoms
-
Cardiac troponin I (TnI) and T (TnT): Interpretation and evaluation in acute coronary syndromes
-
Myocardial Ischemia & infarction: Reactions, ECG Changes & Symptoms
-
The left ventricle in myocardial ischemia and infarction
-
Factors that modify the natural course in acute myocardial infarction (AMI)
-
ECG in myocardial ischemia: ischemic changes in the ST segment & T-wave
-
ST segment depression in myocardial ischemia and differential diagnoses
-
ST segment elevation in acute myocardial ischemia and differential diagnoses
-
ST elevation myocardial infarction (STEMI) without ST elevations on 12-lead ECG
-
T-waves in ischemia: hyperacute, inverted (negative), Wellen's sign & de Winter's sign
-
ECG signs of myocardial infarction: pathological Q-waves & pathological R-waves
-
Other ECG changes in ischemia and infarction
-
Supraventricular and intraventricular conduction defects in myocardial ischemia and infarction
-
ECG localization of myocardial infarction / ischemia and coronary artery occlusion (culprit)
-
The ECG in assessment of myocardial reperfusion
-
Approach to patients with chest pain: differential diagnoses, management & ECG
-
Stable Coronary Artery Disease (Angina Pectoris): Diagnosis, Evaluation, Management
-
NSTEMI (Non ST Elevation Myocardial Infarction) & Unstable Angina: Diagnosis, Criteria, ECG, Management
-
STEMI (ST Elevation Myocardial Infarction): diagnosis, criteria, ECG & management
-
Introduction to Coronary Artery Disease (Ischemic Heart Disease) & Use of ECG
-
Conduction Defects11 Chapters
-
Overview of atrioventricular (AV) blocks
-
First-degree AV block (AV block I, AV block 1)
-
Second-degree AV block: Mobitz type 1 (Wenckebach) & Mobitz type 2 block
-
Third-degree AV block (3rd degree AV block, AV block 3, AV block III)
-
Management and treatment of AV block (atrioventricular blocks)
-
Intraventricular conduction delay: bundle branch blocks & fascicular blocks
-
Right bundle branch block (RBBB): ECG, criteria, definitions, causes & treatment
-
Left bundle branch block (LBBB): ECG criteria, causes, management
-
Left bundle branch block (LBBB) in acute myocardial infarction: the Sgarbossa criteria
-
Fascicular block (hemiblock): Left anterior & left posterior fascicular block
-
Nonspecific intraventricular conduction delay (defect)
-
Overview of atrioventricular (AV) blocks
-
Cardiac Hypertrophy & Enlargement5 Chapters
-
Atrial and ventricular enlargement: hypertrophy and dilatation on ECG
-
ECG in left ventricular hypertrophy (LVH): criteria and implications
-
Right ventricular hypertrophy (RVH): ECG criteria & clinical characteristics
-
Biventricular hypertrophy ECG and clinical characteristics
-
Left atrial enlargement (P mitrale) & right atrial enlargement (P pulmonale) on ECG
-
Atrial and ventricular enlargement: hypertrophy and dilatation on ECG
-
Drugs & Electrolyte Imbalance3 Chapters
-
Genetics, Syndromes & Miscellaneous7 Chapters
-
ECG J wave syndromes: hypothermia, early repolarization, hypercalcemia & Brugada syndrome
-
Brugada syndrome: ECG, clinical features and management
-
Early repolarization pattern on ECG (early repolarization syndrome)
-
Takotsubo cardiomyopathy (broken heart syndrome, stress induced cardiomyopathy)
-
Pericarditis, myocarditis & perimyocarditis: ECG, criteria & treatment
-
Eletrical alternans: the ECG in pericardial effusion & cardiac tamponade
-
Long QT Syndrome (LQTS)
-
ECG J wave syndromes: hypothermia, early repolarization, hypercalcemia & Brugada syndrome
-
Exercise Stress Testing (Exercise ECG)6 Chapters
-
Introduction to exercise stress testing (treadmill test, exercise ECG)
-
Indications, Contraindications, and Preparations for Exercise Stress Testing
-
Exercise stress test (exercise ECG): protocols, evaluation & termination
-
Exercise stress testing in special patient populations
-
Exercise physiology: from normal response to myocardial ischemia & chest pain
-
Evaluation of exercise stress test: ECG, symptoms, blood pressure, heart rate, performance
-
Introduction to exercise stress testing (treadmill test, exercise ECG)
Right ventricular hypertrophy (RVH): ECG criteria & clinical characteristics
ECG and clinical characteristics in right ventricular hypertrophy (RVH)
Right ventricular hypertrophy (RVH)
During normal circumstances, the left ventricle is many times larger than the right ventricles, which is why the QRS complex is dominated completely by left ventricular vectors. Hence, right ventricular hypertrophy must be pronounced in order to come to the expression on ECG. Moderate right ventricular hypertrophy may not alter the ECG significantly. The ECG is particularly helpful in RVH because echocardiography is less sensitive with respect to RVH, because the right ventricle is difficult to visualize clearly with trans thoracic echocardiography.
Chapter content
ToggleCauses of right ventricular hypertrophy
Lung disease (with increased pulmonary vascular resistance), congenital heart disease (transposition of the great arteries, pulmonary valve stenosis, atrial septal defect, ventricular septal defect), tricuspid valve regurgitation are the most common causes.
ECG changes in right ventricular hypertrophy
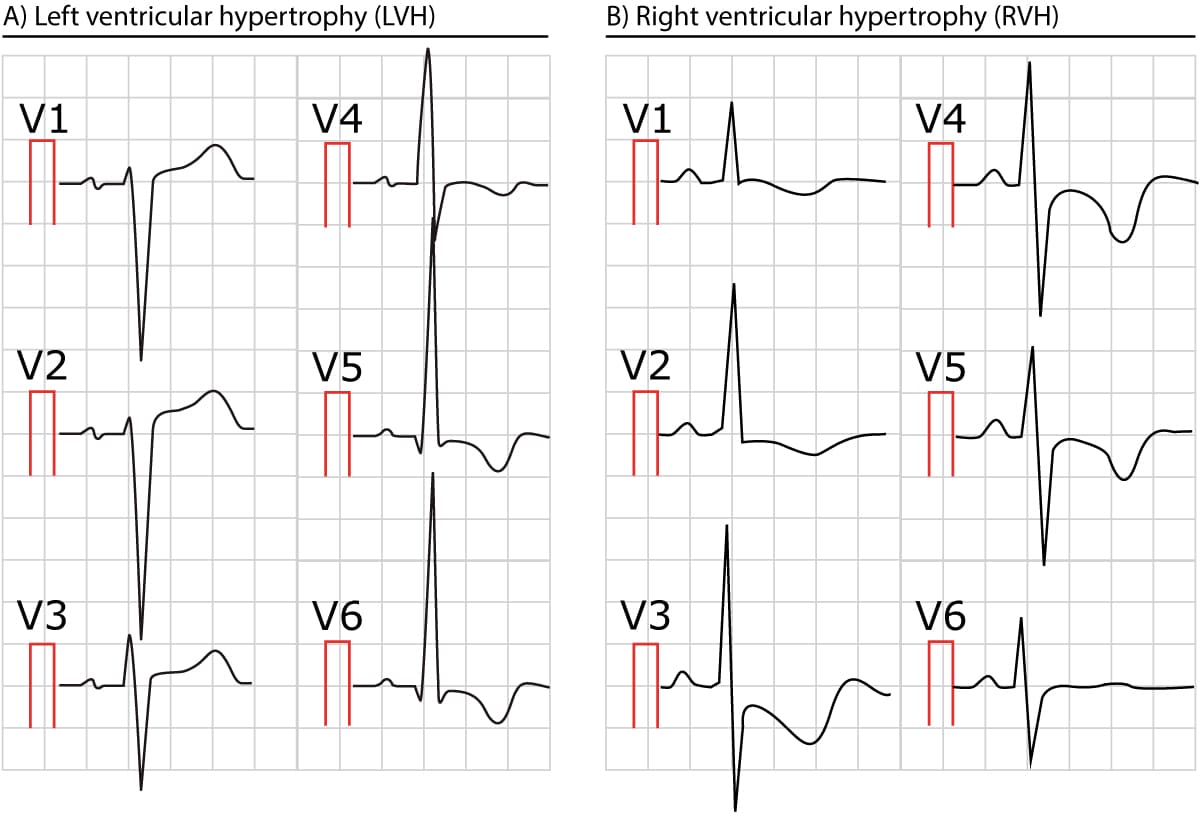
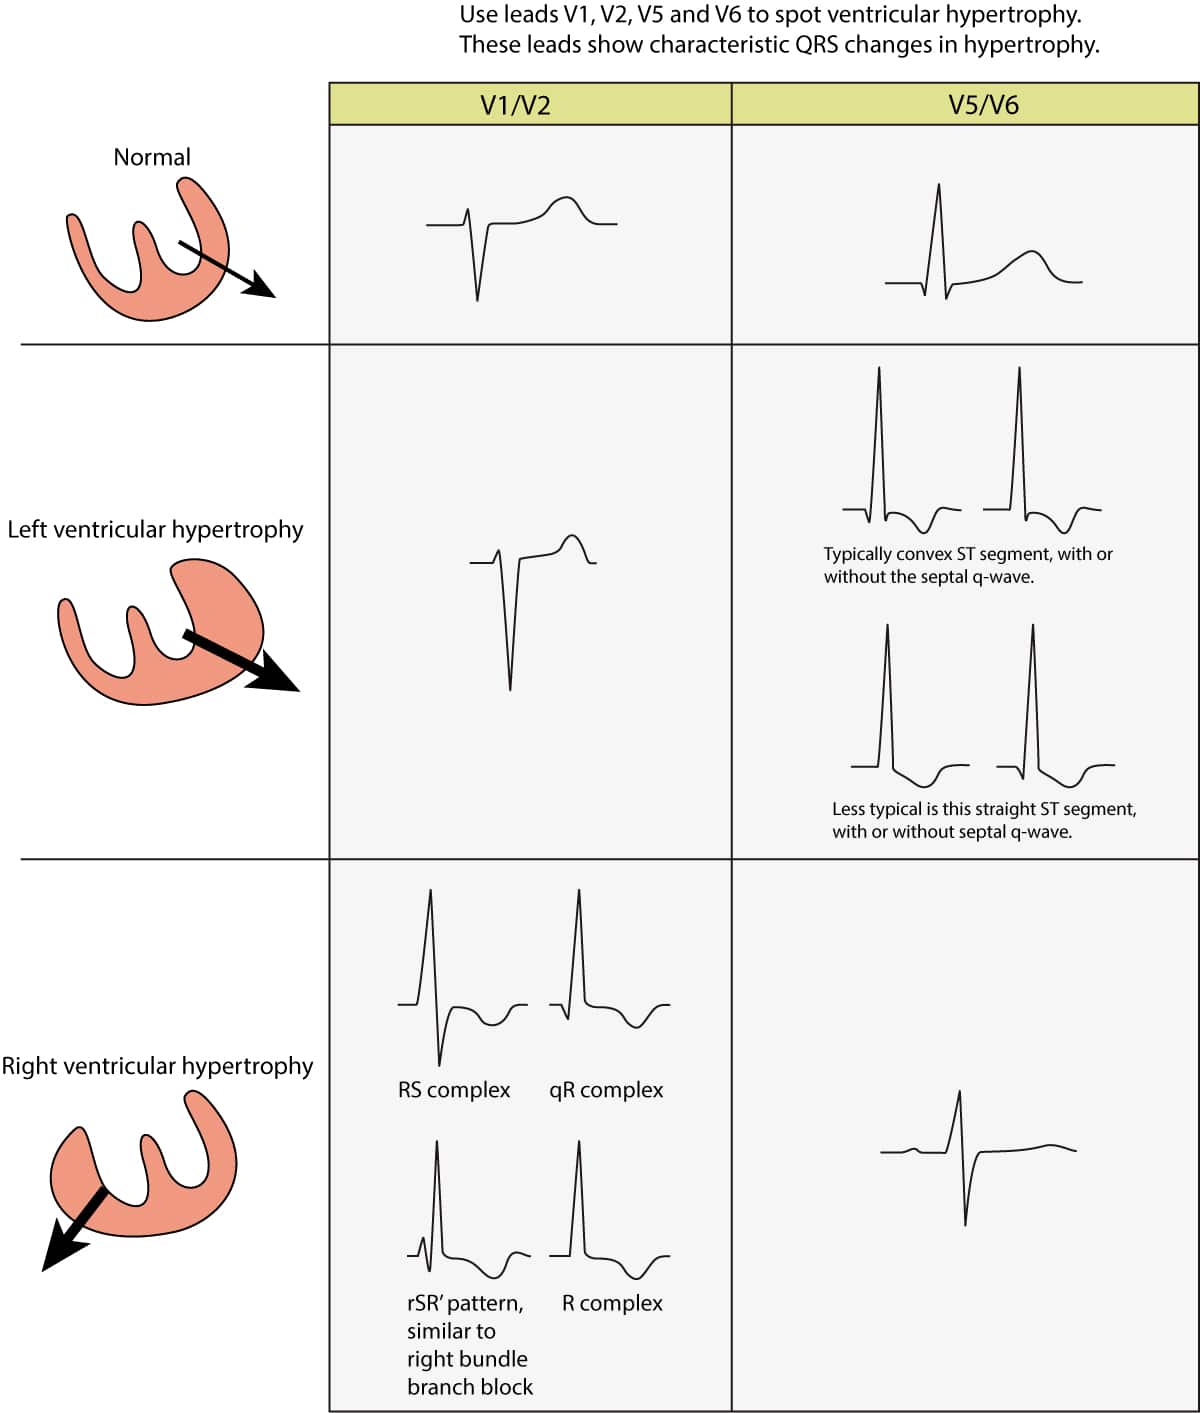
- V1 and V2 shows larger R-waves and smaller S-waves. The R-wave may be larger than the S-wave. R-wave peak time is typically prolonged (35 to 55 milliseconds) in V1–V2. Hence, the QRS duration is slightly prolonged (but it does not reach 120 milliseconds, unless there is concomitant bundle branch block).
- rSR’ pattern is occasionally seen in V1–V2. This resembles, but is not, right bundle branch block (RBBB).
- Secondary ST-T changes are common in V1–V3. The ST-T segment is usually discordant to the QRS complex.
- V5, V6, I and aVL displays smaller R-waves than normal. Along with larger R-waves in right sided leads, the R-wave progression may be opposite.
- The electrical axis is virtually always shifted to the right. Right axis deviation is almost mandatory.
- S-waves are occasionally seen in leads I, II and III (SISIISIII pattern).
- P pulmonale is very common.