
ECG in myocardial ischemia: ischemic changes in the ST segment & T-wave
ECG in acute myocardial ischemia: ischemic ST segment & T-wave changes
This chapter discusses typical and atypical changes in the ST segment and the T-wave during myocardial ischemia. A thorough discussion of the electrophysiological principles, ECG changes and clinical implications is provided. The reader should already be familiar with the classification of acute coronary syndromes. Subsequent chapters will deal with ST segment elevation myocardial infarction (STEMI) and non ST segment elevation myocardial infarction (Non-STEMI, NSTEMI) in detail. Although myocardial ischemia may affect every aspect of the ECG – from heart rhythm to QTc interval – the most prominent and reliable ECG changes occur in the ST segment and the T-wave. This chapter focuses mainly on ST segment deviations (ST segment depression, ST segment elevation) and T-wave changes.
The reader may wish to view the video lecture on The ST segment, J point, J 60 point and T-wave to facilitate understanding of this chapter.
The normal ST segment and T-wave
The ST segment
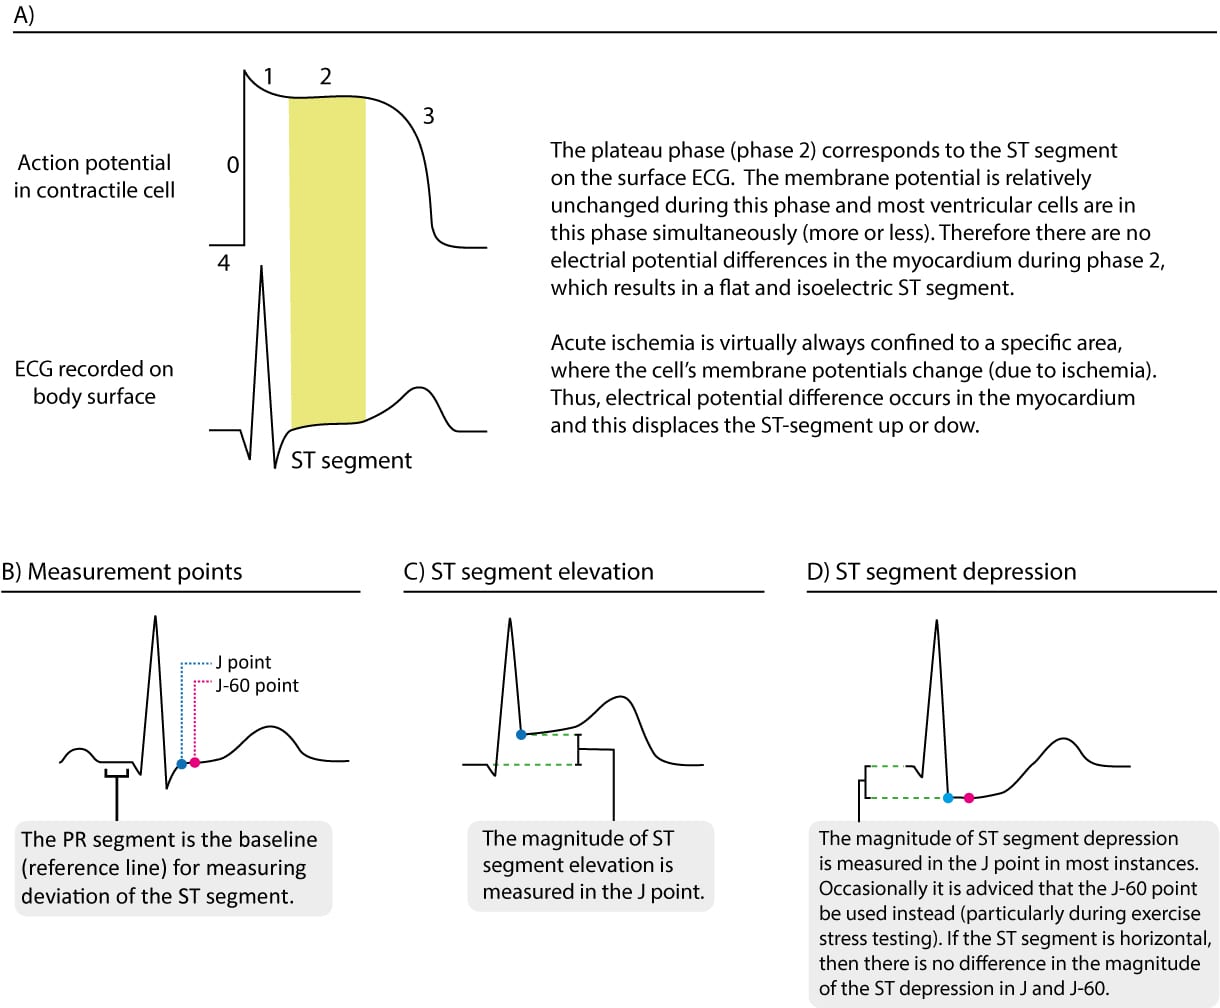
The ST segment represents the plateau phase (phase 2) of the cardiac action potential. It stretches from the J point to the onset of the T-wave (Figure 1 A). The plateau phase has a long duration which enables the majority of the ventricular myocardium to contract simultaneously. Since the membrane potential is relatively unchanged during the plateau phase, the potential differences in the myocardium will be small during this phase. Therefore, the ST segment should be isoelectric, which means that it should be flat and on the same level as the baseline (recall that the baseline is the level of the PR segment). Refer to Figure 1 B.
The T-wave
The transition from the ST segment to the T-wave is smooth, as is the transition between phases 2 and 3 of the action potential (Figure 1 A). The T-wave represents the rapid repolarization phase (phase 3). The T-wave is normally concordant with the QRS complex, which means that a net positive QRS complex should be followed by a positive T-wave and vice versa (a net negative QRS complex is normally followed by a negative T-wave).
Normal findings regarding the direction of the T-wave
- Lead I, II, –aVR, V5 and V6 should display positive T-waves in adults.
- Lead aVR normally displays a negative T-wave.
- Lead III may occasionally display an isolated T-wave inversion. This is considered normal if the neighboring lead (aVF) does not display T-wave inversion.
- Lead aVL may also occasionally display an isolated T-wave inversion.
- Lead aVF: positive T-wave, but occasionally flat.
- Lead V1: Inverted or flat T-wave is rather common, particularly in women. The T-wave inversion is concordant with the QRS complex.
- Leas V7–V9: should display a positive T-wave.
ST segment changes are typically accompanied by T-wave changes
Because phase 2 and phase 3 are electrophysiologically related, changes in the ST segment are typically accompanied by T-wave changes on the ECG. The term ST-T changes is commonly used in clinical practice to refer to changes occurring on the ST-T segment (from the J point to the end of the T-wave).
Ischemic ST-T changes
Ischemia affects the plateau phase (phase 2) and the rapid repolarization phase (phase 3), which is why ischemia causes changes to the ST segment and T-wave (ST-T changes). The ST segment may be either elevated or depressed. The T-wave may diminish in amplitude (flat T-waves), become negative (T-wave inversion) or even increase markedly in amplitude (hyperacute T-wave).
Which of these ST-T changes occur depends on the localization, extension and timing of the ischemia. For example, ST-T changes early in ischemia differ from those in later phases. Moreover, a wide range of other conditions may cause similar ST-T changes and every clinician must be able to differentiate between ischemic and non-ischemic ST-T changes.
Myocardial ischemia causes changes to the ST segment and T-wave (ST-T changes).
- The ST segment may be either elevated or depressed (in relation to the PR segment). This is referred to as ST segment elevation and ST segment depression.
- The T-wave may diminish in amplitude (flat T-waves), become negative (T-wave inversion) or even increase markedly in amplitude (hyperacute T-wave).
Measuring ST segment elevation and depression on ECG
In the case of ST segment elevation or ST segment depression, the magnitude of the elevation or depression must be measured. ST segment elevation is measured from the baseline (i.e. the reference level, which is the level of the PR segment) to the J point. The J point is the point where the QRS complex ends and the ST segment starts (J stands for junction). ST segment depression is also measured from the same baseline to the J point. Refer to Figure 1 panels B, C and D. Hence, ST segment depression implies that the J point is located below the baseline and ST segment elevation implies that the J point is located above the baseline. Refer to Figure 2. If the PR segment is difficult to discern, one may use the TP segment (the line between the T-wave and the P-wave) as the reference level, but this is rarely needed.

Electrophysiological explanations to ischemic ST-T changes: injury currents
The electrophysiological explanations for ischemic ST-T changes have been debated since year 1909 when Eppinger and Rothberger first described ischemic ECG changes. There is no robust theory as to why ischemia induces ST-T changes. However, it is generally acknowledged that ischemia primarily affects the repolarization (phase 2 and phase 3) but it also affects the resting membrane potential (phase 4), by making it less negative. Ischemia also reduces the duration of the action potential. Hence, the action potential in ischemic myocardium will differ from that of non-ischemic myocardium. Differences in the action potential lead to electrical potential differences between normal and ischemic myocardium. These potential differences will result in electrical currents – referred to as injury currents – between normal and ischemic myocardium during systole (due to changed action potential) and diastole (due to changed resting membrane potential). It is generally accepted that these injury currents explain the emergence of ST segment elevations and depression, as well as T-wave changes.
The two main types of ischemia are transmural and subendocardial ischemia. Transmural ischemia implies that the entire wall thickness – from endocardium to epicardium – is affected in the area supplied by the occluded coronary artery. In subendocardial ischemia, only the subendocardium is affected.
Transmural ischemia: ST segment elevation myocardial infarction (STEMI, STE-ACS)
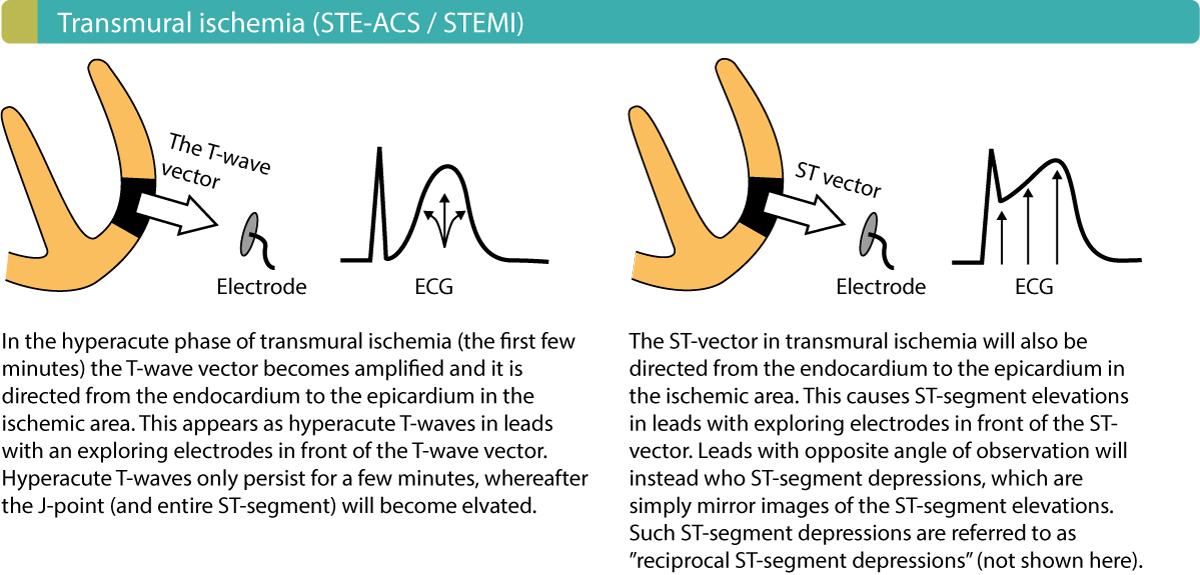
The injury currents in transmural ischemia (which manifests as STE-ACS and leads to STEMI) redirect the ST vector such that it becomes directed from the endocardium to the epicardium in the ischemic area (Figure 3). This leads to ST segment elevations in the leads which observe the ischemic area. For example, ST segment elevations in V3–V4 indicate ongoing transmural ischemia located in the anterior wall of the left ventricle. The more intensive the ischemia, the greater the ST segment elevation. Similarly, the larger the affected area, the more ECG leads will display ST segment elevation.
Although ST-segment elevations are the hallmark of transmural ischemia, they are actually preceded by hyperacute T-waves. These T-waves are symmetric, broad-based and have high amplitude. They occur immediately (within seconds) following occlusion of the coronary artery. It is believed that hyperacute T-waves are caused by increased concentrations of potassium (along with changes in repolarization) in the ischemic area. Hyperacute T-waves have a short duration and they diminish within a few minutes, after which the ST segment becomes elevated.
Since hyperacute T-waves are of very short duration and they arise the moment that the occlusion occurs, it is uncommon to spot these in clinical practice. However, clinicians who regularly see patients with chest discomfort will certainly encounter hyperacute T-waves every now and then (ischemia is a highly dynamic process and some patients will develop a complete occlusion while monitored). Also, note that high T-waves (but not hyperacute) may persist for a few hours following the occlusion.
It should also be noted that ECG leads whose exploring electrode is angled approximately opposite to the leads showing ST-segment elevations may show ST segment depressions. This is simply because these leads record the same ST-vector, but from the opposite direction. Such ST-segment depressions are referred to as reciprocal ST-segment depressions.
Subendocardial ischemia: Non ST segment elevation myocardial infarction (Non-STEMI/NSTEMI, NSTE-ACS)
The injury currents in subendocardial ischemia (which manifests as NSTE-ACS) redirect the ST-vector such that it becomes directed from the epicardium to the endocardium and the back (Figure 4). This results in ST-segment depressions and T-wave inversions. However, the leads displaying these ECG changes are not necessarily indicative of the ischemic area. In other words, ST-segment depressions or T-wave inversions in leads V3–V4 do not indicate that the ischemia is located anteriorly. It follows that ST-segment depressions and T-wave inversions cannot localize the ischemic area.

